netTerrain 9.5 Database Description, Scripting and Reporting Guide

Document Code. GN_D_nT9 - 07 Last revision: 06/28/2022
© 2022 Graphical Networks LLC. All rights reserved.
Graphical Networks and netTerrain are registered trademarks of Graphical Networks LLC. Other
product names mentioned in this manual may be trademarks or registered trademarks of their
respective companies and are hereby acknowledged. With gusto.
If rash, irritation, redness, or swelling develops, discontinue reading. Safety goggles may be
required during use. Do not eat this guide. This disclaimer is not intended as legal advice. For
that, better call Saul.
Image: Holland Tulips
Graphical Networks LLC
Telephone: + 1 - 240 - 912 - 6223
Fax: +1- 240 - 912 - 6339
1 About this guide
1.1 Who should use it
This guide is for netTerrain advanced users or database administrators who need to query the netTerrain database and are too lazy to do it properly using our API.
Ok, we are kidding here, but we did get your attention with that last statement, didn’t we? This guide is a great resource for anything related to querying the database for read-only purposes, such as building queries for reporting and data aggregation tasks. This guide also explains how the dashboard designer works. For many applications it is impractical to write a whole API module, such as when creating a simple query for a dashboard widget. The creation of the query may take 10 minutes and even in the unlikely event of a database structure change that affects it, rewriting it may take very little time.
It is worth noting, however, that an overreliance of querying the database can have negative effects, let alone trying to write data back to it. If there is a change in the netTerrain database schema your scripts may break. This is highly unlikely since most scripts will query from tables and fields that really don’t change. Even if the tables change, we almost never take fields out. Still, it is fair to say that scripts against the database may not be forwards compatible.
Understanding the database schema is important for the creation of scripts needed for reports, aggregate functions using expressions, custom table views or queries used by the dashboard designer.
For some reason, from time to time we get the question about how the database is structured “in order to know how to write data back to the database”. One word: Yikes! That is an absolute no-no for so many obvious reasons that we could devote an entire chapter to it. For starters, if you do that you are probably bypassing business rules that break data consistency. Use the API instead, which was designed exactly for that purpose.
When interacting with the netTerrain database make sure you always work in read-only mode. If you insist on writing back to the database, you may want to start updating your resume for a nifty career change because you are on your way to putting the mighty ‘sh’ back in IT.
The design of queries for custom dashboard elements or expressions is covered under the maintenance agreement, but in many cases, you want to still design your own scripts or maybe you just don’t feel like talking to us. We understand.
1.2 Assumptions
The database description guide assumes that users have a basic knowledge of Transact SQL, database design and querying, as well as Microsoft Office tools and netTerrain end-user functions.
In short, we suggest you brush up on those mad SQL skills lurking somewhere in the back of your brain or else you will have to resort to your DBA. Studies from Oxford and Harvard University have consistently shown that DBAs are 37.8% more helpful when you offer them food and a whopping 84.1% more excited about writing a script if you give them a Graphical Networks T-shirt.
2 Database Description
This chapter provides a description of the database used by netTerrain. It includes descriptions of the tables, select entity relationships diagrams, sample use cases and other information related to the underlying structure of the data stored in the database. The description of user defined functions, triggers or stored procedures is outside the scope of this guide.
2.1 Admin Tables
The admin tables in netTerrain are all tables that contain data related to the admin functions in netTerrain: the storage of users, groups and audit trail information.
2.1.1 Table: [AuditHistory]
All the netTerrain audit trail records are stored in this table.
2.1.1.1 Sample use case
The following query shows how to retrieve all different diagrams where a specific user (in this case with Id=94000000000004) triggered an INSERT action)
SELECT DISTINCT a.ParentId, n.Name

FROM AuditHistory a LEFT OUTER JOIN Nodes n ON a.ParentId=n.Id

WHERE a.UserId=94000000000004 AND a.[Action]='INSERT'

ORDER BY n.Name DESC
2.1.1.2 Structure
| Key | Name | Data Type | Description |
|---|---|---|---|
| PK | Id | decimal(14,0), not null | |
| InstanceId | decimal(14,0), not null | Id of affected record. In general this is a node, link or type Id | |
| ParentId | decimal(14,0), null | Parent Id of affected record. In general this is the parent Id of a node or link. In the case of the affected record being an inter diagram link, the Parent Id is usually the parent of the location of the starting leg. | |
| Table | nvarchar(30), not null | String containing the name of the table of the affected record. | |
| FieldId | decimal(14,0), null | This is the PropertyId of the affected field. Not all audited events record a FieldId (such as DELETE and INSERT actions). | |
| FieldAlias | nvarchar(30), null | If applicable, this is the name of the affected Property Id. | |
| FieldValue | nvarchar(4000), null | If applicable, this is the value of the affected Property, in the event of an UPDATE. | |
| OldValue | nvarchar(4000), null | In the case of an UPDATE event where the affected field had a non NULL value, this field stores the previous value. | |
| Timestamp | datetime2(7), not null | Timestamp of the event. | |
| Action | nvarchar(30), not null | Type of event recorded, such as an INSERT, UPDATE or DELETE action. | |
| UserId | decimal(14,0), not null | Id of the user who triggered the event. |
2.1.2 Table: [AuditLoginHistory]
This table records the login activity of users, including successful logins, failed login attempts and logouts.
2.1.2.1 Sample use case
The following query shows how to retrieve all failed logins.
SELECT a.*, u.Name

FROM AuditLoginHistory a INNER JOIN Users u ON a.UserId=u.Id

WHERE a.[Action]='Bad Credentials'

ORDER BY u.Name
2.1.2.2 Structure
| Key | Name | Data Type | Description |
|---|---|---|---|
| PK | Id | decimal(14,0), not null | |
| UserId | decimal(14,0), null | Id of the user who triggered the event. | |
| Action | nvarchar(255), null | Type of event recorded, such as a ‘Login’, ‘Logout’ or ‘Bad Credentials’ action. | |
| Timestamp | datetime2(7), null | Timestamp of the event. | |
| Purpose | nvarchar(32), null |
2.1.3 : [AuditUserTokensHistory]
This table records the token activity of users.
2.1.3.1 Structure
| Key | Name | Data Type | Description |
|---|---|---|---|
| PK | Id | decimal(14,0), not null | |
| TokenId | decimal(14,0), not null | Id of the token that triggered the event. | |
| Method | nvarchar(255), null | ||
| Endpoint | nvarchar(255), null | ||
| Timestamp | datetime2(7), null | Timestamp of the event. |
2.1.4 Table: [DeviceStatusOverrides]
This table is used for storing overrides defined for devices. Each status value entry applies to all device types.
2.1.4.1 Structure
| Key | Name | Data Type | Description |
|---|---|---|---|
| PK | Id | decimal(14,0), not null | |
| Name | nvarchar(255), not null | ||
| Effect | tinyint, not null |
2.1.5 Table: [GlobalSettings]
This table is for internal application use only and stores global application server settings.
2.1.5.1 Structure
| Key | Name | Data Type | Description |
|---|---|---|---|
| PK | Name | nvarchar(255), not null | |
| Value | sql_variant, not null | ||
| IsFloat | bit, null | ||
| FloatValue | float, null | ||
| Id | Decimal(14,0) not null |
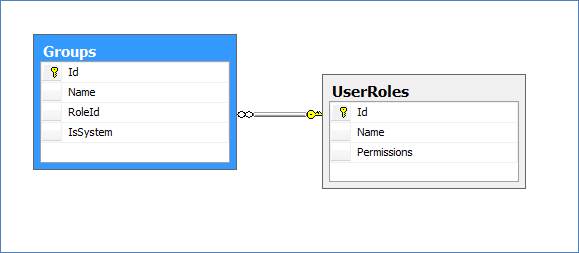
2.1.6 Table: [Groups]
This table stores all the groups of users that exist in netTerrain. These users are manually created through the admin console interface and can contain manually created users or be synchronized with Active Directory groups.
2.1.6.1 Related ERD
2.1.6.2 Sample use case
The following query shows how to retrieve all groups with admin permissions.
2.1.6.3 Structure
| Key | Name | Data Type | Description |
|---|---|---|---|
| PK | Id | decimal(14,0), not null | |
| Name | nvarchar(255), not null | Name of the group. | |
| FK | RoleId | decimal(14,0), not null | Default role Id for the group. Values (In the UserRoles table) include: -1 (Not defined), 0 (No Access), 1 (Read Only), 2 (Annotator), 3 (Editor), 4 (Power User), 5 (Admin). |
| IsSystem | bit, null | System groups (such as admin, readonly, etc.) have this flag is set to true. |
2.1.7 Table: [ImportSchedule]
Internal table that organizes the scheduler for batch import processes.
2.1.7.1 Structure
| Key | Name | Data Type | Description |
|---|---|---|---|
| PK | Id | decimal(14,0), not null | |
| FileName | nvarchar(255), not null | Name of the file. | |
| FK | UserId | decimal(14,0), not null | User that triggered the batch process |
| ImportType | int, not null | Importer used. | |
| Status | Int, not null | ||
| DateOfSchedule | Datetime, not null | ||
| LogFile | nvarchar(255) | ||
| DiagramId | decimal(14, 0) | Target diagram |
2.1.8 Table: [IPToolsetParams]
This table retains the IP toolset options for IP based objects.
2.1.8.1 Structure
| Key | Name | Data Type | Description |
|---|---|---|---|
| PK | Id | int, not null | |
| Name | nvarchar(50), not null | Name of the option. | |
| Params | nvarchar(254), null | The params to be used for the application. | |
| App | nvarchar(1023), not null | Application to be called on the user machine. | |
| Enabled | bit, not null | Availability status of the toolset. |
2.1.9 Table: [LinkNotifications]
This table stores the notifications set for links. Notifications provide a mechanism to trigger an email to a set of users based on a value change for a given field and link type.
2.1.9.1 Structure
| Key | Name | Data Type | Description |
|---|---|---|---|
| PK | Id | decimal(14, 0), not null | |
| PropertyId | decimal(14, 0), not null | Id of property for which the value change triggers the email | |
| RuleId | int, not null | Rule to be used for the notification (=, <, >, etc.) | |
| Value | nvarchar(255), null | Value that triggers the notification | |
| Header | nvarchar(255), null | Email header | |
| Body | varchar(MAX), null | Email body | |
| Destination | nvarchar(255), null | Email destination address |
2.1.10 Table: [NodeNotifications]
This table stores the notifications set for nodes. Notifications provide a mechanism to trigger an email to a set of users based on a value change for a given field and node type.
2.1.10.1 Structure
| Key | Name | Data Type | Description |
|---|---|---|---|
| PK | Id | decimal(14, 0), not null | |
| PropertyId | decimal(14, 0), not null | Id of property for which the value change triggers the email | |
| RuleId | int, not null | Rule to be used for the notification (=, <, >, etc.) | |
| Value | nvarchar(255), null | Value that triggers the notification | |
| Header | nvarchar(255), null | Email header | |
| Body | varchar(MAX), null | Email body | |
| Destination | nvarchar(255), null | Email destination address |
2.1.11 Table: [ObjectTriggers]
This table stores settings for the event handler.
2.1.11.1 Structure
| Key | Name | Data Type | Description |
|---|---|---|---|
| PK | Id | decimal(14, 0), not null | |
| ObjectId | decimal(14, 0), not null | ||
| EventType | int, not null | ||
| EventArgs | nvarchar(4000), null | ||
| ActionType | int, not null | ||
| ActionArgs | nvarchar(4000), null |
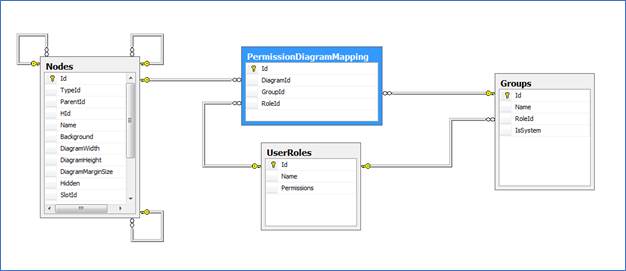
2.1.12 Table: [PermissionDiagramMappingForGroups]
This table stores the diagram permissions that are mapped for a given group, or in netTerrain terms, group exceptions.
2.1.12.1 Related ERD
2.1.12.2 Structure
| Key | Name | Data Type | Description |
|---|---|---|---|
| PK | Id | decimal(14,0), not null | |
| FK | DiagramId | decimal(14,0), not null | Id of the diagram that has the group exceptions. |
| FK | GroupId | decimal(14,0), not null | Group id for which an exception is defined. |
| FK | RoleId | decimal(14,0), not null | Role id associated with the exception. |
2.1.13 Table: [PermissionDiagramMappingForUsers]
This table stores the diagram permissions that are mapped for a given user, or in netTerrain terms, user exceptions.
2.1.13.1 Structure
| Key | Name | Data Type | Description |
|---|---|---|---|
| PK | Id | decimal(14,0), not null | |
| FK | DiagramId | decimal(14,0), not null | Id of the diagram that has the group exceptions. |
| FK | UserId | decimal(14,0), not null | User id for which an exception is defined. |
| FK | RoleId | decimal(14,0), not null | Role id associated with the exception. |
2.1.14 Table: [Tutorials]
This table stores metadata associated with the netTerrain tutorials
| Key | Name | Data Type | Description |
|---|---|---|---|
| PK | Id | decimal(14,0), not null | |
| Name | nvarchar(255), not null | Tutorial name. | |
| Order | tinyint, not null | Tutorial sequence |
2.1.15 Table: [UserRoles]
This table stores the roles that can be assigned to groups. Currently netTerrain includes the following roles:
- -1 = Not Defined
- 0 = No Access
- 1 = Read Only
- 2 = Annotator
- 3 = Edit
- 4 = Power User
- 5 = Admin
| Key | Name | Data Type | Description |
|---|---|---|---|
| PK | Id | decimal(14,0), not null | |
| Name | nvarchar(255), not null | Role name. | |
| Permissions | int, not null | Permission code (-1, 0, 1, 2, 3, 4, 5) |
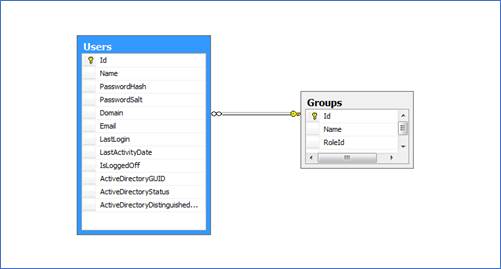
2.1.16 Table: [Users]
This table stores all users in netTerrain. Both, native users and users discovered via Active Directory are contained here.
2.1.16.1 Related ERD
2.1.16.2 Sample Use case
The following query shows a way to retrieve all native users.
2.1.16.3 Structure
| Key | Name | Data Type | Description |
|---|---|---|---|
| PK | Id | decimal(14,0), not null | |
| Name | nvarchar(255), not null | Name of the user. | |
| PasswordHash | nvarchar(255), null | ||
| PasswordSalt | nvarchar(255), null | ||
| FK | Domain | decimal(14,0), not null | The group the user belongs to. |
| nvarchar(255), null | |||
| LastLogin | datetime2(7), not null | Datetime value of the last login. | |
| LastActivityDate | datetime2(7), not null | Datetime value of the last activity. | |
| IsLoggedOff | bit, null | Flag to determine whether the user is currently logged on or not. | |
| ActiveDirectoryGUID | nvarchar(255), null | AD related field. | |
| ActiveDirectoryStatus | nvarchar(255), null | AD related field. | |
| ActiveDirectoryDistinguishedName | nvarchar(255), null | AD related field. | |
| IsOverrideADDomain | int, null | AD related field. | |
| Description | nvarchar(4000), null | User description. | |
| Comments | nvarchar(4000), null | User comments. | |
| DateLastAudit | datetime2(7), not null | Date of last audit for the user. | |
| isLocked | bit, not null | Flag to determine if the user was locked for some reason. | |
| ShowHelpMessages | bit, not null | Flag to determine if the user will be shown help messages. | |
| Language | int, not null | Language integer code | |
| AccountType | int, not null | ||
| ShowOnlineBar | bit, not null | Flag to determine if user should be see the who’s online indicator | |
| EmailConfirmed | bit, not null | ||
| SecurityStamp | nvarchar(64), null | ||
| PhoneNumber | nvarchar(32), null | ||
| PhoneNumberConfirmed | bit, not null | ||
| TwoFactorEnabled | bit, not null | ||
| AccessFailedCount | int, not null | ||
| Selected2FAProvider | int, not null | ||
| GoogleAuthenticatorConfirmed | bit, not null | ||
| GoogleAuthenticatorSecretKey | nvarchar(64), null | ||
| UseMetricSystem | bit, not null | ||
| Theme | nvarchar(255), null | ||
| ShowImportWarning | bit, not null |
2.1.17 Table: [UserTokens]
Table to store user tokens.
2.1.17.1 Structure
| Key | Name | Data Type | Description |
|---|---|---|---|
| PK | Id | decimal(14,0), not null | |
| Prefix | nvarchar(255), not null | ||
| TokenHash | nvarchar(255), not null | ||
| OwnerId | decimal(14,0), not null | ||
| Issued | datetime2(7), not null | ||
| Expires | datetime2(7), not null | ||
| Status | int, not null | ||
| Description | nvarchar(4000), null |
2.2 Catalog tables
The catalog tables in netTerrain are all tables that contain data related to the power user functions in netTerrain: the storage of node and link types, properties, overrides and other catalog related metadata.
2.2.1 Table: [CircuitListValues]
This table stores all the custom properties defined for the circuit entity.
2.2.1.1 Structure
| Key | Name | Data Type | Description |
|---|---|---|---|
| PK | id | decimal(14,0), not null | |
| PropertyId | decimal(14,0), not null | Id of the property with the list value | |
| Value | nvarchar(255), not null | List value |
2.2.2 Table: [CircuitProperties]
This table stores all the custom properties defined for the circuit entity.
2.2.2.1 Structure
| Key | Name | Data Type | Description |
|---|---|---|---|
| PK | id | decimal(14,0), not null | |
| Name | nvarchar(255), not null | Name of the property. | |
| IsSystem | bit, not null | Flag to determine if this is a system property (not removable) or not | |
| ShowInACRA | bit, not null | Flag to determine if the field should be displayed in the ACRA dialog |
2.2.3 Table: [cities]
This table is a metadata table that contains information about cities that can be used in manually generated backgrounds with embedded lat/long information.
2.2.3.1 Structure
| Key | Name | Data Type |
|---|---|---|
| PK | id | decimal(14,0), not null |
| Name | nvarchar(255), not null | |
| Latitude | float, null | |
| Longitude | float, null | |
| Country | nvarchar(255), not null |
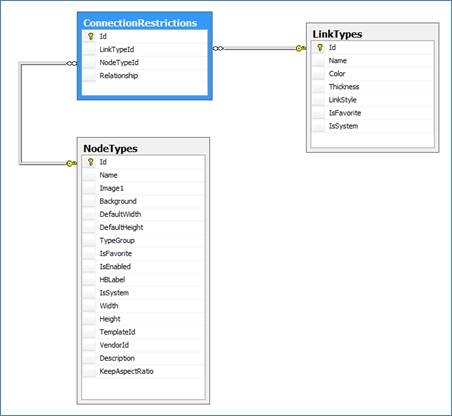
2.2.4 Table: [ConnectionRestrictions]
This table stores information about link type restrictions.
2.2.4.1 Related ERD
2.2.4.2 Sample use case
The following query shows how to retrieve all link types for which there are restrictions that prevent them from being connected to nodes of a certain type.
SELECT DISTINCT lt.[Name]

FROM LinkTypes lt INNER JOIN ConnectionRestrictions c ON lt.Id=c.LinkTypeId AND c.Relationship=0
2.2.4.3 Structure
| Key | Name | Data Type | Description |
|---|---|---|---|
| PK | Id | decimal(14,0), not null | |
| FK | LinkTypeId | decimal(14,0), not null | Link Type Id for which the restriction is applied. |
| FK | NodeTypeId | decimal(14,0), not null | Restricted or allowed Node Type Id. |
| Relationship | smallint, not null | Type of restriction. Two values are currently supported: 0, where netTerrain will prevent an instance of the link type to be connected to an instance of type Node Type, and 1, where netTerrain enforces an instance of the link type to be connected to an instance of the node type (or an instance of any other enforced node type). |
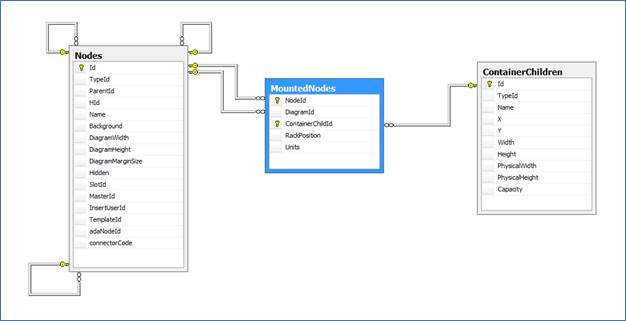
2.2.5 Table: [ContainerChildren]
This table contains the information about rack containers. Any containers associated with their parent racks are stored here.
2.2.5.1 Related ERD
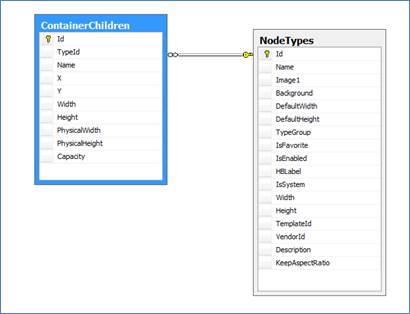
2.2.5.2 Sample use case
The following query shows how to retrieve the number of containers assigned per rack type.
SELECT r.[Name], COUNT(c.Id) AS [ContainerCount]

FROM ContainerChildren c INNER JOIN NodeTypes r ON c.TypeId=r.Id

GROUP BY r.Name
2.2.5.3 Structure
| Key | Name | Data Type | Description |
|---|---|---|---|
| PK | Id | decimal(14,0), not null | |
| FK | TypeId | decimal(14,0), not null | Parent Rack type Id. |
| Name | nvarchar(255), null | Name of the container. Currently this field is not in use. | |
| X | float, null | Left border x value of the container object. The value is in netTerrain units (hundredths of an inch) and does not account for the page margins. | |
| Y | float, null | Top border y value of the container object. The value is in netTerrain units (hundredths of an inch) and does not account for the page margins. | |
| Width | float, null | Width of the container object in netTerrain units. This width is the image width of the object on a diagram in hundredths of an inch, not the physical width of the rackmountable area. | |
| Height | float, null | Height of the container object in netTerrain units. This width is the image width of the object on a diagram in hundredths of an inch, not the physical width of the rackmountable area. | |
| PhysicalWidth | float, null | Physical width of the container object (usually a rack mountable area for a front or back view of a rack). This unit is in inches. | |
| PhysicalHeight | float, null | Physical height of the container object (usually a rack mountable area for a front or back view of a rack). This unit is in rack units. | |
| Capacity | int, null | Physical capacity of the container object (usually a rack mountable area for a front or back view of a rack). This is measured in rack units. | |
| RackPositionOrder | bit, not null | Flag to determine if units should be counted sequentially from bottom to top or in reverse. |
2.2.6 Table: [DefaultCustomProperties]
This table stores the default custom fields that should be added to a newly created device, card or rack type by default.
2.2.6.1 Structure
| Key | Name | Data Type | Description |
|---|---|---|---|
| Id | decimal(14,0), not null | ||
| TypeGroup | nvarchar(250), not null | Name of the category. | |
| Name | decimal(14,0), null | The id of a parent category or null. |
2.2.7 Table: [LinkCategories]
This table stores the categories that links may fall under.
2.2.7.1 Structure
| Key | Name | Data Type | Description |
|---|---|---|---|
| PK | Id | decimal(14,0), not null | |
| Name | nvarchar(250), not null | Name of the category. | |
| FK | ParentId | decimal(14,0), null | The id of a parent category or null. |
| HId | hierarchyid, null | ||
| Icon | nvarchar(255), null | The filename of the icon corresponding to the category. | |
| IsFavorite | bit, not null | Flag to determine if a type is in the favorites menu. |
2.2.8 Table: [LinkOverrides]
This table stores all visual override settings for link types.
2.2.8.1 Related ERD
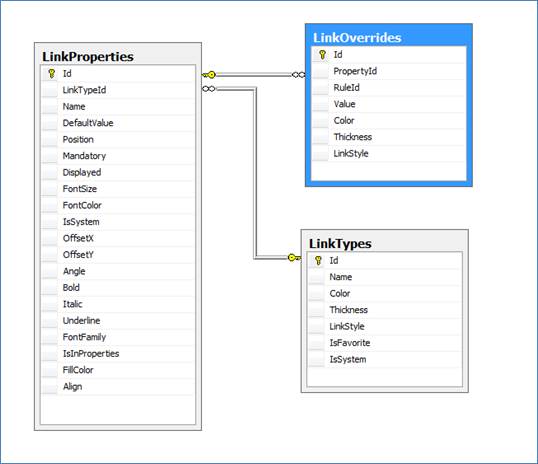
2.2.8.2 Sample use case
The following query shows how to retrieve the visual override count for each link type.
SELECT DISTINCT lt.[Name], COUNT(o.Id) AS [OverrideCount]

FROM LinkTypes lt

 INNER JOIN LinkProperties lp ON lt.Id=lp.LinkTypeId INNER JOIN

 LinkOverrides o ON lp.Id=o.PropertyId

GROUP BY lt.[Name]
2.2.8.3 Structure
| Key | Name | Data Type | Description |
|---|---|---|---|
| PK | Id | decimal(14,0), not null | |
| FK | PropertyId | decimal(14,0), not null | Id of the property for which the override is being defined. |
| RuleId | int, not null | Rule type, such as =, >,< and contains. | |
| Value | nvarchar(255), not null | The value that needs to be matched for the property in order for the override to be triggered. | |
| Color | nchar(10), null | Link override color. | |
| Thickness | int, null | Link override thickness. | |
| LinkStyle | int, null | Link override style. | |
| IsOverride | bit, not null | Flag to determine of this attribute is an override or just a list item. | |
| StartArrow | int, null | Start arrow override value. | |
| EndArrow | int, null | End arrow override value. |
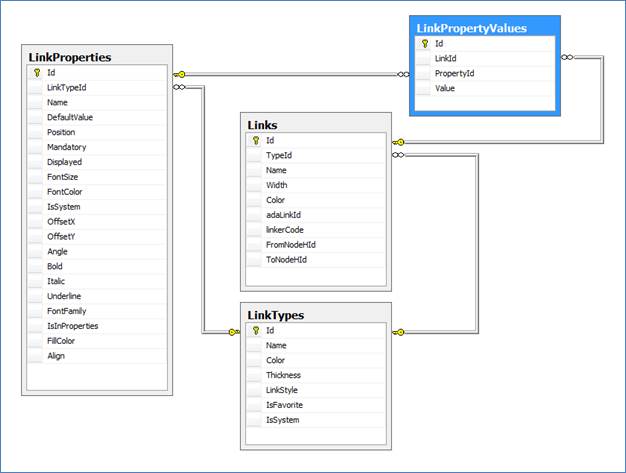
2.2.9 Table: [LinkProperties]
This table stores all the fields defined for each link type in the netTerrain catalog.
2.2.9.1 Related ERD
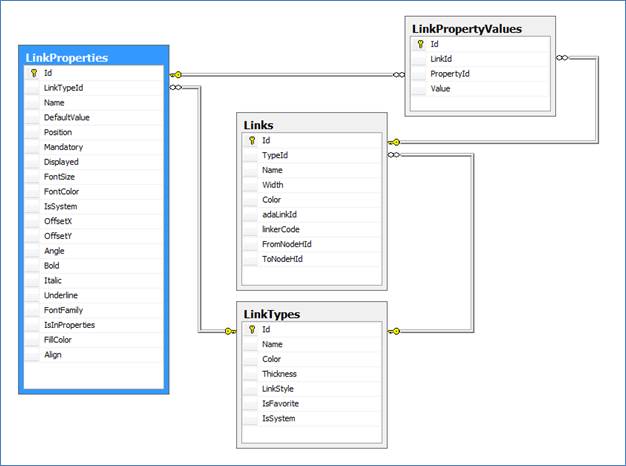
2.2.9.2 Sample use case
The following query shows how to retrieve the property count for each link type.
SELECT DISTINCT lt.[Name], COUNT(lp.Id) AS [PropertyCount]

FROM LinkTypes lt

 INNER JOIN LinkProperties lp ON lt.Id=lp.LinkTypeId

GROUP BY lt.[Name]
2.2.9.3 Structure
| Key | Name | Data Type | Description |
|---|---|---|---|
| PK | Id | decimal(14,0), not null | |
| FK | LinkTypeId | decimal(14,0), not null | Id of the parent link type. |
| Name | nvarchar(255), not null | Field name. | |
| DefaultValue | nvarchar(449), null | Field default value. | |
| Position | int, not null | Position of the field in the properties window. | |
| Mandatory | bit, null | Flag to determine whether the field must be filled out. | |
| Displayed | smallint, null | Default displayed field status. 1 means the field is displayed on the diagram. This value can be overridden on a per instance basis. | |
| FontSize | int, null | Default font size, in case the field is displayed. This value can be overridden on a per instance basis. | |
| FontColor | char(7), null | Default font color, in case the field is displayed. This value can be overridden on a per instance basis. | |
| IsSystem | bit, not null | Fields flagged as true (such as Name) cannot be deleted from the field list. | |
| OffsetX | float, not null | Default offset of x position, in case the field is displayed. This value can be overridden on a per instance basis. | |
| OffsetY | float, not null | Default offset of y position, in case the field is displayed. This value can be overridden on a per instance basis. | |
| Angle | int, not null | Default angle, in case the field is displayed. This value can be overridden on a per instance basis. | |
| Bold | bit, null | Default boldness flag, in case the field is displayed. This value can be overridden on a per instance basis. | |
| Italic | bit, null | Default italics flag, in case the field is displayed. This value can be overridden on a per instance basis. | |
| Underline | bit, null | Default underline flag, in case the field is displayed. This value can be overridden on a per instance basis. | |
| FontFamily | nvarchar(255), null | Default font family value, in case the field is displayed. This value can be overridden on a per instance basis. | |
| IsInProperties | bit, not null | Flag to determine whether the field is displayed in the properties window. | |
| FillColor | char(7), null | Default fill color value, in case the field is displayed. This value can be overridden on a per instance basis. | |
| Align | int, not null | Default alignment value, in case the field is displayed. This value can be overridden on a per instance basis. 0 means left alignment, 1 means center alignment and 2 means right alignment. | |
| Anchor | int, not null | Field to determine anchor properties for that link property. | |
| LockList | bit, null | Flag to determine whether a list field associated with that property should be locked or editable. | |
| IsTypeField | bit, null | Flag to determine whether the property is the type property for displayed field purposes. | |
| IsUniqueForThisType | bit, null | Flag to determine whether the property value for each instance must be unique across instances of the same type. | |
| IsUniqueForAllTypes | bit, null | Flag to determine whether the property value for each instance must be unique across all instances of any type. | |
| Justification | int, not null | Index that determines the type of justification that applies to the text instance | |
| UprightAlignment | Bit, not null | Flag that determines whether displayed fields should always look upright or not based on the direction of a link |
2.2.10 Table: [LinkTypes]
This table stores all the link types defined in the netTerrain catalog.
2.2.10.1 Related ERD
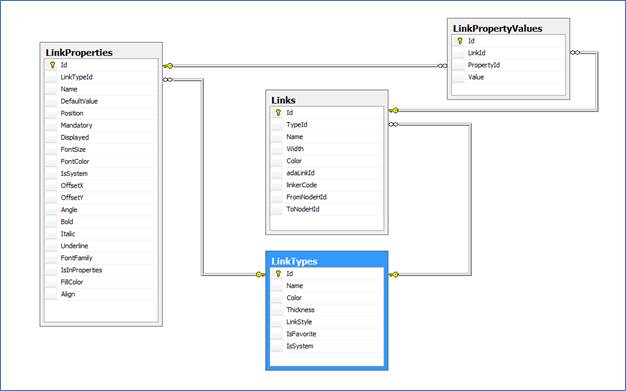
2.2.10.2 Sample use case
The following query shows how to retrieve the property count for each link type.
SELECT DISTINCT lt.[Name], COUNT(lp.Id) AS [PropertyCount]

FROM LinkTypes lt

 INNER JOIN LinkProperties lp ON lt.Id=lp.LinkTypeId

GROUP BY lt.[Name]
2.2.10.3 Structure
| Key | Name | Data Type | Description |
|---|---|---|---|
| PK | Id | decimal(14,0), not null | |
| Name | nvarchar(255), not null | Name of the link type. | |
| Color | char(7), null | Link type default color. | |
| Thickness | int, null | Link type default thickness. | |
| LinkStyle | int, null | Link type default style. | |
| IsFavorite | bit, not null | Flag that sets the link type as favorite in the link type menu button. | |
| IsSystem | bit, not null | Flag that specifies whether the link type can be deleted. | |
| CategoryId | decimal(14,0), null | If applies, the category of the link type. | |
| StartArrow | int, null | Start arrow properties. | |
| EndArrow | int, null | End arrow properties. | |
| SnappedToEdge | bit, not null | Flag to determine if the link should be snapped to the edge of the rect value determining the end nodes. | |
| IsEnabled | bit, not null | Flag that specifies whether the link type is enabled in the catalog or not. | |
| MatchingPortConnectors | bit, not null | Flag that specifies whether the link type requires the connectors on each end point to match, in case the endpoints are ports. | |
| UseForACRAPatch | bit, not null | Flag to determine if a link type is allowed to be presented as a valid patch type during an ACRA patching process | |
| ExcludableFROMACRA | bit, not null | Flag to determine if a link type should be excluded from an ACRA calculation | |
| Mode | tinyint, null | Identifier for a cable mode (0=single, 1=multi) |
2.2.11 Table: [NodeCategories]
This table stores the categories that nodes may fall under.
2.2.11.1 Structure
| Key | Name | Data Type | Description |
|---|---|---|---|
| PK | Id | decimal(14,0), not null | |
| Name | nvarchar(250), not null | Name of the category. | |
| FK | ParentId | decimal(14,0), null | The id of a parent category or null. |
| HId | hierarchyid, null | ||
| FK | TypeGroup | int, not null | Corresponds to one of the type groups. |
| Icon | nvarchar(255), null | The filename of the icon corresponding to the category. | |
| IsFavorite | bit, not null | Flag to determine of that category should be in the favorites menu. |
2.2.12 Table: [NodeOverrides]
The NodeOverrides table stores all the visual overrides assigned to node types.
2.2.12.1 Related ERD
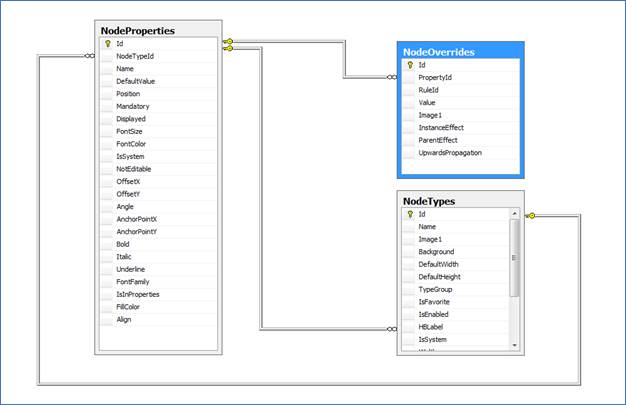
2.2.12.2 Sample use case
The following query shows a count of node overrides per node type.
SELECT nt.Name, COUNT(nt.Name) AS [Override Count]

FROM NodeOverrides nov INNER JOIN NodeProperties np ON nov.PropertyId = np.Id INNER JOIN

 NodeTypes nt ON np.NodeTypeId = nt.Id

GROUP BY nt.Name

ORDER BY [Override Count] DESC
2.2.12.3 Structure
| Key | Name | Data Type | Description |
|---|---|---|---|
| PK | Id | decimal(14,0), not null | |
| FK | PropertyId | decimal(14,0), not null | Id if the property for which the override is applied. |
| RuleId | int, not null | The type of override rule that is applied to the property (=, >,< , etc.) | |
| Value | nvarchar(255), not null | The value that triggers the override. | |
| Image1 | nvarchar(255), null | Image that is applied to the node that triggers the override. | |
| InstanceEffect | int, not null | Effect that is applied to the node that triggers the override. | |
| ParentEffect | int, not null | Effect that is applied to the parent of the node that triggers the override. | |
| UpwardsPropagation | int, not null | type of upwards propagation that is applied to the parent/s of the node that triggers the override. | |
| IsOverride | bit, not null | Flag to determine of that attribute is an override or a list value. |
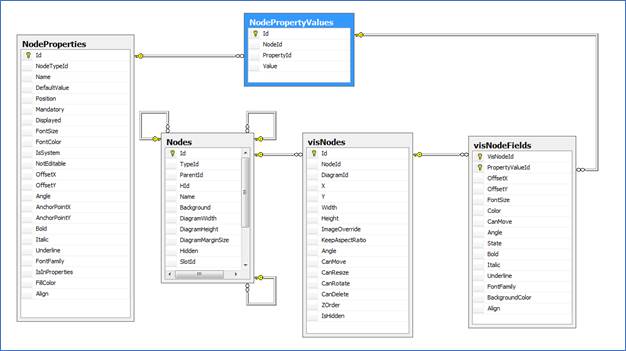
2.2.13 Table: [NodeProperties]
The NodeProperties table stores all the custom properties assigned to node types.
2.2.13.1 Related ERD
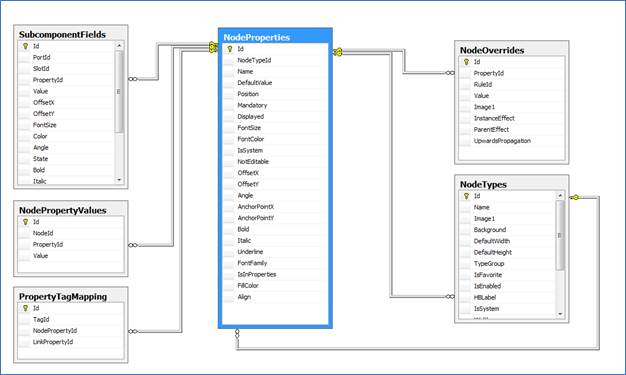
2.2.13.2 Sample use case
The following query shows a count of node properties per node type.
SELECT nt.Name, COUNT(nt.Name) AS [Property Count]

FROM NodeProperties np INNER JOIN NodeTypes nt ON np.NodeTypeId = nt.Id

GROUP BY nt.Name

ORDER BY [Property Count] DESC
2.2.13.3 Structure
| Key | Name | Data Type | Description |
|---|---|---|---|
| PK | Id | decimal(14,0), not null | |
| FK | NodeTypeId | decimal(14,0), not null | |
| Name | nvarchar(255), not null | Property name. | |
| DefaultValue | nvarchar(449), null | Property default value. | |
| Position | int, not null | Property position in properties window. | |
| Mandatory | bit, null | Flag to specify whether the property is mandatory. | |
| Displayed | smallint, null | Display status. | |
| FontSize | int, null | Default font size for property, when set as a displayed field. | |
| FontColor | char(7), null | Default font color for property, when set as a displayed field. | |
| IsSystem | bit, not null | Flag to specify whether the property can be deleted or not. | |
| NotEditable | bit, not null | Flag to specify whether the property can be edited or not. | |
| OffsetX | float, not null | Default x coordinate offset for property, when set as a displayed field. | |
| OffsetY | float, not null | Default y coordinate offset for property, when set as a displayed field. | |
| Angle | int, not null | Default angle for property, when set as a displayed field. | |
| AnchorPointX | tinyint, not null | Default x coordinate anchor point for property, when set as a displayed field. | |
| AnchorPointY | tinyint, not null | Default y coordinate anchor point for property, when set as a displayed field. | |
| Bold | bit, null | Default font boldness for property, when set as a displayed field. | |
| Italic | bit, null | Default italics setting for property, when set as a displayed field. | |
| Underline | bit, null | Default underline setting for property, when set as a displayed field. | |
| FontFamily | nvarchar(255), null | Default font family for property, when set as a displayed field. | |
| IsInProperties | bit, not null | Flag to specify if the property is displayed in the properties window. | |
| FillColor | char(7), null | Default font fill color for property, when set as a displayed field. | |
| Align | int, not null | Default alignment for property, when set as a displayed field. | |
| LockList | bit, null | Flag to determine whether a list field associated with that property should be locked or editable | |
| IsTypeField | bit, null | Flag to determine whether the property is the type property for displayed field purposes. | |
| IsUniqueForThisType | bit, null | Flag to determine whether the property value for each instance must be unique across instances of the same type. | |
| IsUniqueForAllTypes | bit, null | Flag to determine whether the property value for each instance must be unique across all instances of any type. | |
| Justification | int, not null | Index that determines the type of justification that applies to the text instance | |
| SNMP_OID | nvarchar(255), null | Stores the OID of a device type; used with the collector discovery process |
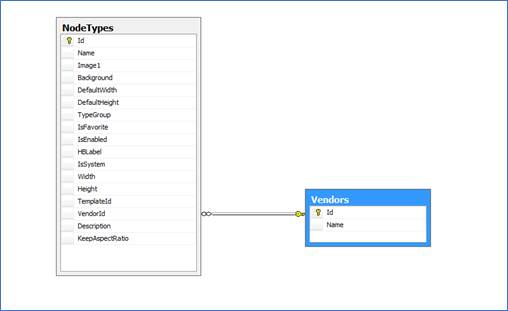
2.2.14 Table: [NodeTypes]
This table stores all the node type definitions that exist in the netTerrain catalog. It includes all type groups, such as generic nodes, devices, card types, rack types and so on.
2.2.14.1 Related ERD
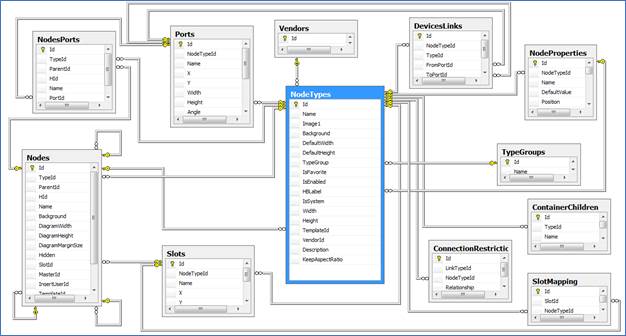
2.2.14.2 Sample use case
The following query retrieves all the properties for generic nodes.
SELECT nt.Name AS [Node Type], np.Id AS [Property Id], np.Name AS [Property Name]

FROM NodeProperties np INNER JOIN NodeTypes nt ON np.NodeTypeId=nt.Id

WHERE nt.TypeGroup=1

ORDER BY [Node Type], np.Name
2.2.14.3 Structure
| Key | Name | Data Type | Description |
|---|---|---|---|
| PK | Id | decimal(14,0), not null | |
| Name | nvarchar(255), not null | Node type name. | |
| Image1 | nvarchar(255), null | Icon image file name. | |
| Background | nvarchar(255), null | Background image file name. | |
| DefaultWidth | float, null | Default Width for a new instance of that type. | |
| DefaultHeight | float, null | Default Height for a new instance of that type. | |
| FK | TypeGroup | int, null | Type group (1= Generic Node, 2=document, 3=comment, 4= stamp, 5=shape, 6= free drawing, 7=Device, 8=rack, 9=port, 10=slot, 11=card, 12 = line node). |
| IsFavorite | bit, not null | Flag to determine of the type is a favorite. | |
| IsEnabled | bit, not null | Flag to determine of the type is enabled in the node type drop down menus. | |
| FK | HBLabel | decimal(14,0), null | Property id that will be used as the hierarchy browser label. |
| IsSystem | bit, not null | Flag to determine of the type can be deleted. | |
| Width | float, null | Default width for smart objects. | |
| Height | float, null | Default height for smart objects. | |
| FK | TemplateId | decimal(14,0), null | Predefined template id for the type. |
| FK | VendorId | decimal(14,0), null | Id of vendor. |
| Description | nvarchar(max), null | Node type description. | |
| KeepAspectRatio | bit, null | Flag to determine whether the aspect ratio should be maintained for instances of that type. | |
| ShowContainerChildren | bit, not null | ||
| DClickBehavior | nvarchar(255), not null | Default double click behavior for that node type. | |
| FK | CategoryId | decimal(14,0), null | The node type’s category, if there is one set. |
| SNMP_OID | nvarchar(255), null | Stores the OID of a device type; used with the collector discovery process | |
| IndependentMounting | bit, not null | ||
| InStock | Int, null | Number of items of the type that are in stock that can be instantiated. |
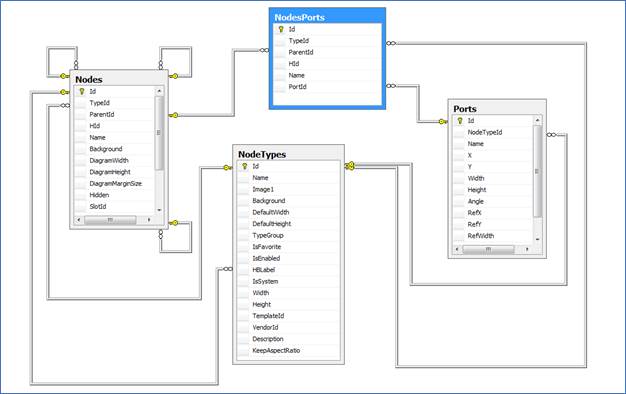
2.2.15 Table: [Ports]
This table stores the port definitions for each of the device models in the netTerrain catalog. This table should not be confused with the NodePorts table, which stores the actual port instances.
2.2.15.1 Related ERD
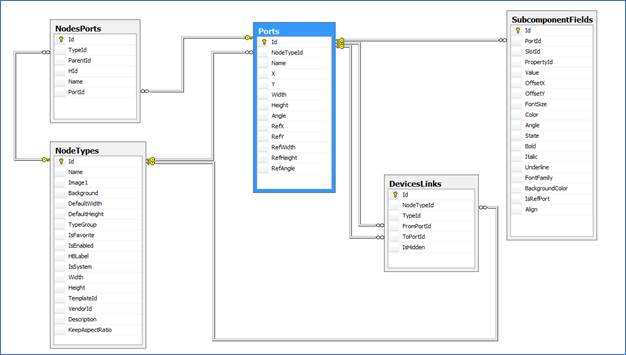
2.2.15.2 Structure
| Key | Name | Data Type | Description |
|---|---|---|---|
| PK | Id | decimal(14,0), not null | |
| FK | NodeTypeId | decimal(14,0), not null | Type id of port. |
| Name | nvarchar(4000), not null | Name of port (usually a port number). | |
| X | float, null | X coordinate of the port object. | |
| Y | float, null | Y coordinate of the port object. | |
| Width | float, null | Width of the port object. | |
| Height | float, null | Height of the port object. | |
| Angle | int, null | Angle of the port object. | |
| RefX | float, null | X coordinate of the reference port object. | |
| RefY | float, null | Y coordinate of the reference port object. | |
| RefWidth | float, null | Width of the reference port object. | |
| RefHeight | float, null | Height of the reference port object. | |
| RefAngle | int, null | Angle of the reference port object. | |
| Path | nvarchar(max), null | ||
| PathInverted | nvarchar(max), null | ||
| AnchorPointX | float, null | X coord for anchor point definition | |
| AnchorPointX | float, null | Y coord for anchor point definition | |
| RefAnchorPointX | float, null | X coord for anchor point definition for ref port | |
| RefAnchorPointY | float, null | Y coord for anchor point definition for ref port | |
| IsHidden | bit, null | ||
| Index | Int, null | Index number used to match up SNMP index scans |
2.2.16 Table: [PropertyEventTypes]
This table stores the types of events defined in the catalog.
2.2.16.1 Structure
| Key | Name | Data Type | Description |
|---|---|---|---|
| PK | Id | decimal(14,0), not null | |
| Name | nvarchar(255), not null | Name of the event type | |
| PropertyId | decimal(14,0), not null | Id of the related property that triggers the event. | |
| Severity | Tinyint, not null | Severity level of the event | |
| Value | nvarchar(255), not null | Value that triggers the event. |
2.2.17 Table: [PropertyTagMapping]
This table stores the mappings between field tags and node or link properties.
2.2.17.1 Related ERD
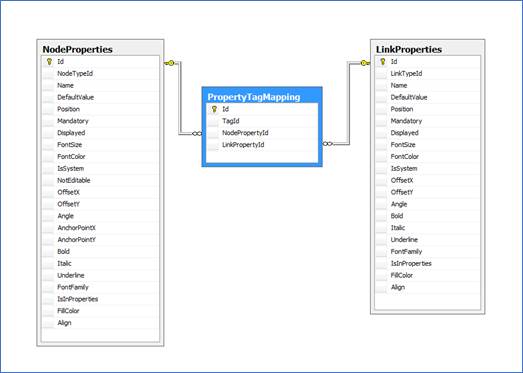
2.2.17.2 Structure
| Key | Name | Data Type | Description |
|---|---|---|---|
| PK | Id | decimal(14,0), not null | |
| TagId | decimal(14,0), not null | Id of the related tag. | |
| FK | NodePropertyId | decimal(14,0), null | Id of the related node property. |
| FK | LinkPropertyId | decimal(14,0), null | Id of the related link property. |
2.2.18 Table: [PropertyTags]
This table stores the tags defined in netTerrain, which are later used to map them to properties for field layering purposes.
2.2.18.1 Structure
| Key | Name | Data Type | Description |
|---|---|---|---|
| PK | Id | decimal(14,0), not null | |
| Name | nvarchar(100), not null | Name of the tag. | |
| IsSystem | bit, not null | Flags any system properties for automatic tagging. |
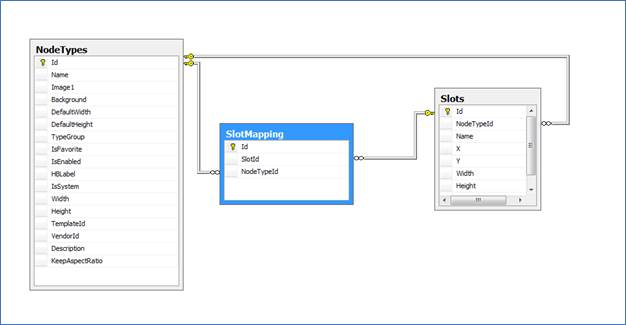
2.2.19 Table: [SlotMapping]
This table stores the slot to node type (usually card types) mappings.
2.2.19.1 Related ERD
2.2.19.2 Sample use case
The following query retrieves the slot mapping count on a per device type basis.
SELECT nt.Name AS [Device Type], s.Name AS [Slot Name], COUNT(sm.Id) AS [Mapping Count]

FROM Slots s INNER JOIN NodeTypes nt ON s.NodeTypeId = nt.Id INNER JOIN SlotMapping sm ON s.Id = sm.SlotId

GROUP BY nt.Name, s.Name, nt.Id, s.Id
2.2.19.3 Structure
| Key | Name | Data Type | Description |
|---|---|---|---|
| PK | Id | decimal(14,0), not null | |
| FK | SlotId | decimal(14,0), not null | Id of the slot to be mapped. |
| FK | NodeTypeId | decimal(14,0), not null | Id of the node type to be mapped. |
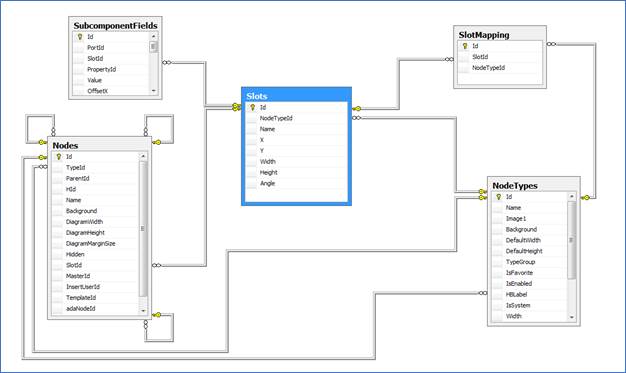
2.2.20 Table: [Slots]
This table stores the slot definitions for each model in the netTerrain catalog.
2.2.20.1 Related ERD
2.2.20.2 Structure
| Key | Name | Data Type | Description |
|---|---|---|---|
| PK | Id | decimal(14,0), not null | |
| FK | NodeTypeId | decimal(14,0), not null | |
| Name | nvarchar(4000), not null | ||
| X | float, null | X coordinate of the slot object. | |
| Y | float, null | Y coordinate of the slot object. | |
| Width | float, null | Width of the slot object. | |
| Height | float, null | Height of the slot object. | |
| Angle | int, null | Angle of the slot object. |
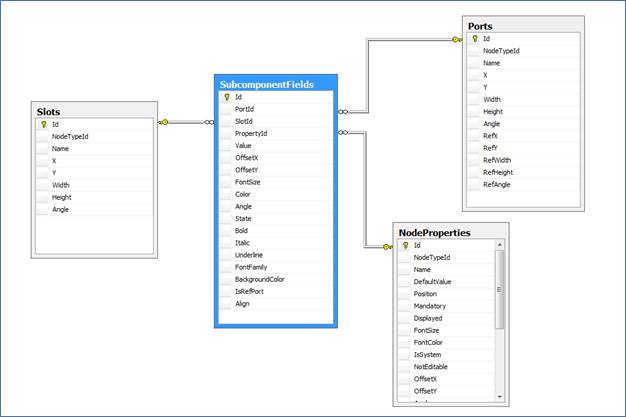
2.2.21 Table: [SubcomponentFields]
This table stores the properties associated with device subcomponents.
2.2.21.1 Related ERD
| Key | Name | Data Type | Description |
|---|---|---|---|
| PK | Id | decimal(14,0), not null | |
| FK | PortId | decimal(14,0), null | Id of port (if applicable) |
| FK | SlotId | decimal(14,0), null | Id of slot (if applicable) |
| FK | PropertyId | decimal(14,0), not null | Id of Property |
| Value | nvarchar(4000), null | Predefined value for the specific property for the subcomponent | |
| OffsetX | float, null | X coordinate offset for a displayed field | |
| OffsetY | float, null | Y coordinate offset for a displayed field | |
| FontSize | int, null | Font size for a displayed field | |
| Color | char(7), null | Color for a displayed field | |
| Angle | int, null | Angle for a displayed field | |
| State | int, not null | Displayed state | |
| Bold | bit, null | Boldness for a displayed field | |
| Italic | bit, null | Italics state for a displayed field | |
| Underline | bit, null | Underline state for a displayed field | |
| FontFamily | nvarchar(255), null | Font Family for a displayed field for a displayed field | |
| BackgroundColor | char(7), null | Fill Color for a displayed field | |
| IsRefPort | bit, not null | Flag to determine if this is a ref port field | |
| Align | int, not null | Align state | |
| Justification | int, not null | Index that determines the type of justification that applies to the text instance |
2.2.22 Table: [SublinkListValues]
This table stores all the list values (drop-down values) associated with any custom fields created for sublinks.
| Key | Name | Data Type | Description |
|---|---|---|---|
| PK | Id | decimal(14, 0), not null | |
| FK | PropertyId | decimal(14, 0), not null | Id of property containing list value |
| Value | nvarchar(255), not null | List value |
2.2.23 Table: [SublinkProperties]
This table stores all the properties (custom fields) created for sublinks.
| Key | Name | Data Type | Description |
|---|---|---|---|
| PK | Id | decimal(14, 0), not null | |
| Name | nvarchar(255), not null | Property name | |
| IsSystem | bit, not null | Flag to identify if the property is a system property |
2.2.24 Table: [TypeGroups]
This table stores the main categories that node types can be associated with. Currently netTerrain contains the following groups:
- 1= Generic Node
- 2=document
- 3=comment
- 4= stamp
- 5=shape
- 6= free drawing
- 7=Device
- 8=rack
- 9=port
- 10=slot
- 11=card
- 12 = line node
| Key | Name | Data Type | Description |
|---|---|---|---|
| PK | Id | int, not null | Type group id (code). |
| Name | nvarchar(255), null | Type group name. |
2.2.25 Table: [Vendors]
This table stores vendor names associated with node types.
2.2.25.1 Related ERD
2.2.25.2 Structure
| Key | Name | Data Type | Description |
|---|---|---|---|
| PK | Id | decimal(14,0), not null | |
| Name | nvarchar(255), not null | Vendor name. |
2.3 Instance (or project) tables
The instance tables in netTerrain are the tables that contain data related to the project: node and link instances, property values, free text and other instance related data.
2.3.1 Table: [BundledLinksMapping]
This table stores the mapping between bundled links and the corresponding containers.
2.3.1.1 Structure
| Key | Name | Data Type | Description |
|---|---|---|---|
| PK | Id | decimal(14,0), not null | |
| FK | ContainerId | decimal(14,0), not null | The id of the container link |
| FK | LinkId | decimal(14,0), not null | The id of the bundled link |
2.3.2 Table: [CircuitPathHops]
This table is used in the context of Outside Plant (OSP) documentation to store the different hops associated with circuit paths in an OSP circuit.
2.3.2.1 Structure
| Key | Name | Data Type | Description |
|---|---|---|---|
| PK | Id | decimal(14,0), not null | |
| FK | CircuitPathId | decimal(14,0), not null | The id of the path of a given circuit |
| OrderInPath | int, not null | The order of the hop within a path | |
| Sequence |
2.3.3 Table: [CircuitPaths]
This table is used in the context of Outside Plant (OSP) documentation to store the different paths associated with an OSP circuit.
2.3.3.1 Structure
| Key | Name | Data Type | Description |
|---|---|---|---|
| PK | Id | decimal(14,0), not null | |
| FK | CircuitId | decimal(14,0), not null | The id of the circuit for which the path is defined |
2.3.4 Table: [CircuitPropertyValues]
This table stores the actual circuit instance values for each custom property
2.3.4.1 Structure
| Key | Name | Data Type | Description |
|---|---|---|---|
| PK | Id | decimal(14,0), not null | |
| FK | CircuitId | decimal(14,0), not null | Id of the circuit that contains the property value. |
| FK | PropertyId | decimal(14,0), not null | Id of the property that stores the value. |
| Value | nvarchar(4000), null | String that stores the value. |
2.3.5 Table: [Circuits]
This table stores all netTerrain circuits. Circuits are not links, but specific point-to-point entities used with netTerrain OSP without a graphical representation in netTerrain.
2.3.5.1 Structure
| Key | Name | Data Type | Description |
|---|---|---|---|
| PK | Id | decimal(14,0), not null | |
| Name | nvarchar(500), not null | ||
| FromDeviceId | decimal(14,0), not null | Id of starting device. | |
| ToDeviceId | decimal(14,0), not null | Id of terminating device. |
2.3.6 Table: [DevicesLinks]
Link presentation metadata table.
2.3.6.1 Structure
| Key | Name | Data Type |
|---|---|---|
| PK | Id | decimal(14,0), not null |
| FK | NodeTypeId | decimal(14,0), not null |
| FK | TypeId | decimal(14,0), not null |
| FK | FromPortId | decimal(14,0), not null |
| FK | ToPortId | decimal(14,0), not null |
| IsHidden | bit, null | |
| Path | nvarchar(MAX) | |
| FromAnchorPointX | Float | |
| FromAnchorPointY | Float | |
| ToAnchorPointX | Float | |
| ToAnchorPointY | Float |
2.3.7 Table: [EmbeddedFiles]
This table stores embedded document information corresponding to objects in the project area.
2.3.7.1 Structure
| Key | Name | Data Type | Description |
|---|---|---|---|
| PK | Id | decimal(14,0), not null | |
| MasterObjectId | decimal(14,0), not null | Id of the object where the document is attached. | |
| FileName | nvarchar(255), not null | Title of the document uploaded. | |
| LockedBy | decimal(14,0), null | When the file is checked out, this will be the id of the user. Otherwise, null. | |
| DeleteMarker | int, null |
2.3.8 Table: [EmbeddedFilesRevisions]
This table stores revision information corresponding to a record in the EmbeddedFiles table.
2.3.8.1 Structure
| Key | Name | Data Type | Description |
|---|---|---|---|
| PK | Id | decimal(14,0), not null | |
| FK | EmbeddedFileId | decimal(14,0), not null | Id of the EmbeddedFile record to be mapped. |
| Timestamp | datetime2(7), not null | The timestamp of the revision. | |
| UserId | decimal(14,0), not null | UserId who made the revision. | |
| ComplexFileName | nvarchar(255), not null | File name as stored in netTerrain. |
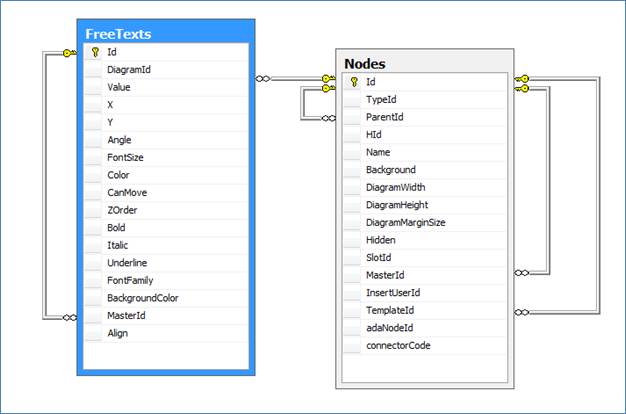
2.3.9 Table: [FreeTexts]
This table stores all instances of free text in the project.
2.3.9.1 Related ERD
2.3.9.2 Sample use case
The following query shows how to retrieve all text objects that exist on a certain diagram, such as the top level (with Id 24000000000001).
2.3.9.3 Structure
| Key | Name | Data Type | Description |
|---|---|---|---|
| PK | Id | decimal(14,0), not null | |
| FK | DiagramId | decimal(14,0), not null | Diagram Id that contains the free text instance. |
| Value | nvarchar(4000), not null | Free text value. | |
| X | float, null | Left border x value of the free text rect object. The value is in netTerrain units (hundredths of an inch) and does not account for the page margins. | |
| Y | float, null | Top border y value of the free text rect object. The value is in netTerrain units (hundredths of an inch) and does not account for the page margins. | |
| Angle | int, null | Angle of the free text rect object. The unit is in degrees. | |
| FontSize | int, null | Free text font size. | |
| Color | char(7), null | Free text font size. | |
| CanMove | bit, null | Free text color. The values are in HTML hex notation. | |
| ZOrder | int, null | Z-order of the free text object. A higher number usually means the object is in front of others. | |
| Bold | bit, null | Free text boldness flag. | |
| Italic | bit, null | Free text italics flag. | |
| Underline | bit, null | Free text underline flag. | |
| FontFamily | nvarchar(255), null | Free text font family, such as ‘Arial’. | |
| BackgroundColor | varchar(7), null | Free text fill color. The values are in HTML hex notation. | |
| FK | MasterId | decimal(14,0), null | Master Id of the free text object, in case it has been aliased. |
| Align | int, not null | Free text alignment value. | |
| IsHidden | bit, null | Flag to determine if the free text is hidden on the diagram. | |
| insertUserId | decimal(14,0), null | Id of the user who inserted the text | |
| Justification | int, not null | Index that determines the type of justification that applies to the text instance |
2.3.10 Table: [LinkPropertyValues]
This table stores the instance values for each property and each link.
2.3.10.1 Related ERD
2.3.10.2 Sample use case
The following query shows how to retrieve the property values just as displayed in the netTerrain properties window for a given link (in this case with id 25000000000011), which also includes NULL values.
SELECT lp.Name, lpv.Value

FROM LinkTypes lt INNER JOIN LinkProperties lp ON lt.Id = lp.LinkTypeId INNER JOIN Links l ON lt.Id = l.TypeId LEFT OUTER JOIN LinkPropertyValues lpv ON lp.Id = lpv.PropertyId AND l.Id = lpv.LinkId

WHERE l.Id = 25000000000011

ORDER BY lp.Position
2.3.10.3 Structure
| Key | Name | Data Type | Description |
|---|---|---|---|
| PK | Id | decimal(14,0), not null | |
| FK | LinkId | decimal(14,0), not null | Id of the link that contains the values. |
| FK | PropertyId | decimal(14,0), not null | Id of the Property that contains the value. |
| Value | nvarchar(4000), null | String value. |
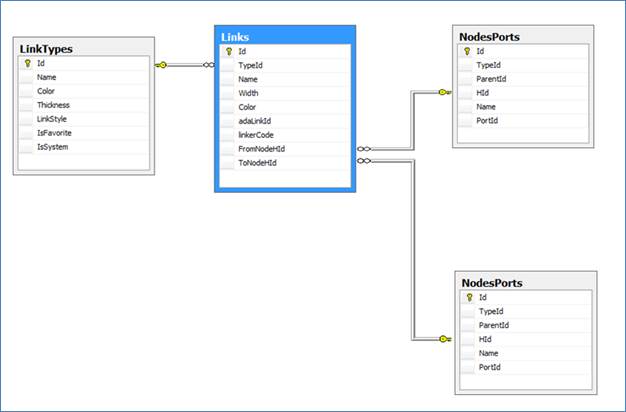
2.3.11 Table: [Links]
This table stores all instances of links.
2.3.11.1 Related ERD (for node endpoints)

Attention!
Notice that the one-to-many relationship for FromNodeHId and ToNodeHId involves the SQL Server datatype HierarchyId (HId), not the decimal Id of the node endpoints.
Also, this ERD represents the case of links that have node objects as endpoints. Links can also have NodePort objects (NodesPorts table) as endpoints. Therefore, this ERD is not strictly speaking a representation of enforced relationships in the database, but an illustration of how to join endpoints in a SQL statement in case that both endpoints are nodes.
Below is the related ERD for port endpoints but take into account that hybrid scenarios are also possible; in which case querying the database may require unions of 4 possible combinations of endpoint classes.
2.3.11.2 Sample use case
The following query shows how to retrieve the property values just as displayed in the netTerrain properties window for a given link (in this case with id 25000000000011), which also includes NULL values.
SELECT lp.Name, lpv.Value

FROM LinkTypes lt INNER JOIN LinkProperties lp ON lt.Id = lp.LinkTypeId INNER JOIN Links l ON lt.Id = l.TypeId LEFT OUTER JOIN LinkPropertyValues lpv ON lp.Id = lpv.PropertyId AND l.Id = lpv.LinkId

WHERE l.Id = 25000000000011

ORDER BY lp.Position
2.3.11.3 Structure
| Key | Name | Data Type | Description |
|---|---|---|---|
| PK | Id | decimal(14,0), not null | |
| FK | TypeId | decimal(14,0), not null | Type Id of the link. |
| Name | nvarchar(4000), null | Link name. | |
| Width | float, null | Instance width. | |
| Color | int, null | Instance color. | |
| adaLinkId | nvarchar(255), null | Reconciliation field, when links are imported using the ITK. | |
| linkerCode | int, null | Linker code field, when links are imported using the ITK. | |
| FromNodeHId | hierarchyid, null | HierarchyId of starting Node (regular nodoe or port). | |
| ToNodeHId | hierarchyid, null | HierarchyId of ending Node (regular nodoe or port). | |
| ExcludeFROMACRA | bit, not null | Flag to determine if a link should be excluded from an automated circuit routing algorithm calculation | |
| CollectorId | nvarchar(255), null | Id of the collector that imported that link in case it was discovered by a collector process. |
2.3.12 Table: [MountedNodes]
This table stores all devices that are rack mounted.
2.3.12.1 Related ERD
2.3.12.2 Sample use case
The following query shows how to retrieve all mounted devices that use 10 or more rack units.
SELECT

  '<a href="http://localhost/i/Diagram/'+ CONVERT(varchar, prnt.Id) + '?blink=' + CONVERT(varchar, n.Id) + '">Show on diagram</a>' as url,

 n.Id,

 n.ParentId,

 nt.Name AS [Device Type],

 n.Name,

 prnt.Name AS Rack,

 mn.RackPosition,

 mn.Units AS [Units Used]

FROM Nodes n

INNER JOIN NodeTypes nt ON nt.Id = n.TypeId

INNER JOIN Nodes prnt ON prnt.Id = n.ParentId

INNER JOIN MountedNodes mn ON n.Id=mn.NodeId

WHERE mn.Units>=10
2.3.12.3 Structure
| Key | Name | Data Type | Description |
|---|---|---|---|
| FK | NodeId | decimal(14,0), not null | Id of the mounted node. |
| FK | DiagramId | decimal(14,0), null | Rack diagram that contains the mounted node. |
| FK | ContainerChildId | decimal(14,0), not null | The rack container id that contains the mounted node. |
| RackPosition | float, not null | Rack position of device. | |
| Units | float, not null | Number of units that device occupies on the container. | |
| PK | Id | decimal(14,0), not null |
2.3.13 Table: [NodePropertyValues]
This table stores each value associated for each node and property. Note that property values that never had a non-null value for a given node are not stored.
2.3.13.1 Related ERD
2.3.13.2 Sample use case
The following query retrieves all node property values formatted as an IP address.
SELECT n.id, npv.Value AS [IP Address], nt.Name AS [Node Type], n.Name AS [Node Name]

FROM NodeProperties np INNER JOIN NodeTypes nt ON np.NodeTypeId=nt.Id

INNER JOIN Nodes n ON nt.Id=n.TypeId INNER JOIN NodePropertyValues npv ON npv.NodeId=n.Id

WHERE npv.PropertyId=np.Id AND np.Name LIKE '%ip%' AND np.Name LIKE '%address%'

AND npv.Value LIKE '%_.%_.%_.%_' AND npv.Value NOT LIKE '%.%.%.%.%' AND npv.Value NOT LIKE '%[^0-9.]%'

AND npv.Value NOT LIKE '%[0-9][0-9][0-9][0-9]%' AND npv.Value NOT LIKE '%[3-9][0-9][0-9]%'

AND npv.Value NOT LIKE '%2[6-9][0-9]%' AND npv.Value NOT LIKE '%25[6-9]%'

ORDER BY CAST(PARSENAME(npv.Value, 4) AS INT), CAST(PARSENAME(npv.Value, 3) AS INT), CAST(PARSENAME(npv.Value, 2) AS INT), CAST(PARSENAME(npv.Value, 1) AS INT), n.Name
The following query retrieves all repeated IP addresses and their count.
SELECT COUNT(npv.Id) AS IP_Count, npv.Value

FROM NodePropertyValues npv INNER JOIN NodeProperties np ON npv.PropertyId=np.Id

WHERE np.Name LIKE '%ip%' AND np.Name LIKE '%address%'

AND npv.Value LIKE '%_.%_.%_.%_' AND npv.Value NOT LIKE '%.%.%.%.%' AND npv.Value NOT LIKE '%[^0-9.]%'

AND npv.Value NOT LIKE '%[0-9][0-9][0-9][0-9]%' AND npv.Value NOT LIKE '%[3-9][0-9][0-9]%'

AND npv.Value NOT LIKE '%2[6-9][0-9]%' AND npv.Value NOT LIKE '%25[6-9]%'

GROUP BY Value

HAVING COUNT(npv.Id) > 1
2.3.13.3 Structure
| Key | Name | Data Type | Description |
|---|---|---|---|
| PK | Id | decimal(14,0), not null | |
| NodeId | decimal(14,0), not null | Id of the node that contains the property value. | |
| FK | PropertyId | decimal(14,0), not null | Id of the property that stores the value. |
| Value | nvarchar(4000), null | String that stores the value. |
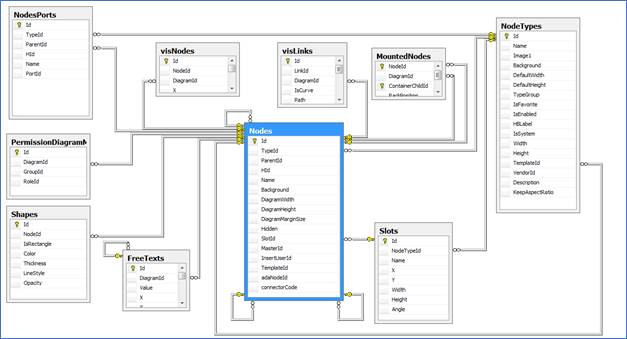
2.3.14 Table: [Nodes]
This table stores all node instances in the netTerrain project.
2.3.14.1 Related ERD
2.3.14.2 Sample use case
The following query retrieves all devices that have at least one port connected to another device.
SELECT a.url,

       a.Id,

       a.[Device Type],

       a.[Device Name],

       a.[Parent Diagram],

       MAX(a.[Link count]) AS LinkCount

FROM

(

SELECT DISTINCT

  '<a href="http://localhost/i/Diagram/'+ CONVERT(varchar, n.ParentId) + '?blink=' +

 CONVERT(varchar, n.Id) + '">Show on diagram</a>' as url, n.Id,

 nt.Name AS [Device Type], n.Name AS [Device Name], n1.Name AS [Parent Diagram], COUNT(l.Id) AS [Link count]

FROM Nodes n INNER JOIN NodeTypes nt ON n.TypeId = nt.Id INNER JOIN NodesPorts np ON n.Id = np.ParentId

INNER JOIN Links l ON np.HId = l.FromNodeHId INNER JOIN Nodes n1 ON n.ParentId = n1.Id INNER JOIN

NodesPorts np1 ON l.ToNodeHId = np1.HId

WHERE nt.TypeGroup = 7 AND np.ParentId!=np1.ParentId

GROUP BY '<a href="http://localhost/i/Diagram/'+ CONVERT(varchar, n.ParentId) + '?blink=' + CONVERT(varchar, n.Id) + '">Show on diagram</a>', n.Id, nt.Name, n.Name, n1.Name

UNION

SELECT DISTINCT

 '<a href="http://localhost/i/Diagram/'+ CONVERT(varchar, n.ParentId) + '?blink=' +

 CONVERT(varchar, n.Id) + '">Show on diagram</a>' as url, n.Id, nt.Name AS [Device Type], n.Name AS [Device Name], n1.Name AS [Parent Diagram], COUNT(l.Id) AS [Link count]

FROM Nodes n INNER JOIN NodeTypes nt ON n.TypeId = nt.Id INNER JOIN NodesPorts np ON n.Id = np.ParentId

INNER JOIN Links l ON np.HId = l.ToNodeHId INNER JOIN Nodes n1 ON n.ParentId = n1.Id INNER JOIN

NodesPorts np1 ON l.FromNodeHId = np1.HId

WHERE nt.TypeGroup = 7 AND np.ParentId!=np1.ParentId

GROUP BY '<a href="http://localhost/i/Diagram/'+ CONVERT(varchar, n.ParentId) + '?blink=' + CONVERT(varchar, n.Id) + '">Show on diagram</a>', n.Id, nt.Name, n.Name, n1.Name

) a

GROUP BY a.url, a.Id, a.[Device Type], a.[Device Name], a.[Parent Diagram]
2.3.14.3 Structure
| Key | Name | Data Type | Description |
|---|---|---|---|
| PK | Id | decimal(14,0), not null | |
| FK | TypeId | decimal(14,0), null | Id of the node type. |
| FK | ParentId | decimal(14,0), null | Id of the parent that contains the node. |
| HId | hierarchyid, null | HierarchyId of the node. | |
| Name | nvarchar(4000), not null | Node name. | |
| Background | nvarchar(255), null | Background image file name. | |
| DiagramWidth | float, null | Width of the diagram associated with the node. | |
| DiagramHeight | float, null | Height of the diagram associated with the node. | |
| DiagramMarginSize | float, null | Margin size of the diagram associated with the node. | |
| Hidden | nvarchar(255), null | Hidden flag. | |
| FK | SlotId | decimal(14,0), null | Id of the corresponding slot type, if applicable. |
| FK | MasterId | decimal(14,0), null | Id of the master node, if applicable (when node is an alias). |
| InsertUserId | decimal(14,0), null | User id that created the node. | |
| FK | TemplateId | decimal(14,0), null | Id of the template diagram, if applicable. |
| adaNodeId | nvarchar(255), null | Id of node in the ITK table, if applicable. | |
| connectorCode | int, null | Id of the connector, if node was inserted by the ITK. | |
| isBlocked | bit, not null | Flag to determine the blocking status of a node. | |
| RackOverrideType | tinyint, null | Override attribute related to racks. | |
| ShowContainerChildren | bit, not null | ||
| DClickBehavior | nvarchar(255), not null | The specified double click action. | |
| MapCoordLeft | float, null | Stores GIS coordinate data. | |
| MapCoordTop | float, null | Stores GIS coordinate data. | |
| MapCoordRight | float, null | Stores GIS coordinate data. | |
| MapCoordBottom | float, null | Stores GIS coordinate data. | |
| MapUnitsType | int, null | Type of unit used for mapped based diagrams. | |
| DynamicMapsSupport | bit, null | Flag to determine if this is a dynamic (OSM) map. | |
| AutoLayoutState | smallint, null | Number specifying the auto layout algorithm to use when accessing the diagram. | |
| MapSource | int, null | GIS map source. | |
| DisplayGrid | bit, null | Display Grid flag. | |
| SnapToGrid | bit, null | Snap to Grid flag. | |
| GridSpacingX | float, null | Grid spacing in the x coordinate. | |
| GridSpacingY | float, null | Grid spacing in the y coordinate. | |
| PageColor | char(7), null | ||
| OverrideTemplateGrid | bit, null | ||
| ReadOnlyForNonAdmins | bit, null | ||
| CollectorId | nvarchar(255), null | Id of the collector that imported that node in case it was discovered by a collector process. | |
| AutoResizeState | Smallint, not null | ||
| ShowHalos | Bit, not null | Flag to determine if the diagram should show halos for nodes that are zoomed out a lot. | |
| ShowClusters | Bit, not null | Flag to determine if the diagram should show clusters for node groupings. | |
| ImageOverride | nvarchar(255), null |
2.3.15 Table: [NodesPorts]
This table contains all instances of ports in the netTerrain project. This table should not be confused with the ports table, which contains all the port definitions for the models in the netTerrain catalog.
2.3.15.1 Structure
| Key | Name | Data Type | Description |
|---|---|---|---|
| PK | Id | decimal(14,0), not null | |
| FK | TypeId | decimal(14,0), not null | Device type Id. |
| FK | ParentId | decimal(14,0), null | Id of the parent device. |
| HId | hierarchyid, null | HierarchyId of the port. | |
| Name | nvarchar(4000), not null | Name of the port instance. | |
| FK | PortId | decimal(14,0), not null | Id of the port definition in the netTerrain catalog, |
| IsBlockedForPatching | bit, not null | ||
| IsInUse | bit, not null |
2.3.16 Table: [Patches]
This table stores all patches associated with circuit definitions in the netTerrain project.
2.3.16.1 Structure
| Key | Name | Data Type | Description |
|---|---|---|---|
| PK | Id | decimal(14,0), not null | |
| FK | CircuitPathId | decimal(14,0), not null | Circuit Path associated with the patch |
| PatchId | decimal(14,0), not null | ||
| FromCrossConnectionId | decimal(14,0), null | ||
| ToCrossConnectionId | decimal(14,0), null | ||
| FromHopId | decimal(14,0), null | ||
| ToHopId | decimal(14,0), null |
2.3.17 Table: [PredefinedSublinkPropertyValues]
This table stores the values for all custom properties used for sublinks (strands).
2.3.17.1 Structure
| Key | Name | Data Type | Description |
|---|---|---|---|
| PK | Id | decimal(14,0), not null | |
| FK | SublinkId | decimal(14,0), not null | Id of the related sublink |
| FK | PropertyId | decimal(14,0), null | Id of the related property |
| FK | Value | decimal(14,0), null | Stored value |
2.3.18 Table: [PredefinedSublinks]
This table stores all strand instances.
2.3.18.1 Structure
| Key | Name | Data Type | Description |
|---|---|---|---|
| PK | Id | decimal(14,0), not null | |
| FK | LinkTypeId | decimal(14, 0), not null | If of the parent Link type |
| Name | nvarchar(4000), null | Name of the strand | |
| Color | char(7), null | Strand color | |
| Mode | tinyint, null | Strand mode (inherited from cable) | |
| BufferColor | char(7), null | Buffer color (inherited from cable) |
2.3.19 Table: [PropertyValueEvents]
This table stores events that were triggered by a value change in netTerrain.
2.3.19.1 Structure
| Key | Name | Data Type | Description |
|---|---|---|---|
| PK | Id | decimal(14,0), not null | |
| ObjectId | decimal(14, 0), not null | ||
| EventTypeId | decimal(14, 0), not null | ||
| AffectedUserId | decimal(14, 0), not null | ||
| TimeReceived | datetime2(7), not null | ||
| AcknowledgedUserId | decimal(14, 0), null | ||
| AcknowledgedTime | datetime2(7), null | ||
| IsCleared | bit, not null | ||
| Notes | nvarchar(500), null |
2.3.20 Table: [RackAudits]
This table stores the audit processes done through the mobile app.
2.3.20.1 Structure
| Key | Name | Data Type | Description |
|---|---|---|---|
| PK | Id | decimal(14,0), not null | |
| UserId | decimal(14, 0), not null | ||
| Date | date, not null | ||
| RackId | decimal(14, 0), not null |
2.3.21 Table: [RackAuditsNotFoundBarcodes]
This table stores the records of barcodes not found during an audit process done through the mobile app.
2.3.21.1 Structure
| Key | Name | Data Type | Description |
|---|---|---|---|
| PK | Id | decimal(14,0), not null | |
| AuditId | decimal(14, 0), not null | ||
| Barcode | nvarchar(255), not null |
2.3.22 Table: [SublinkPropertyValues]
This table stores all the values for all custom fields created for sublinks (strands).
2.3.22.1 Structure
| Key | Name | Data Type | Description |
|---|---|---|---|
| PK | Id | decimal(14,0), not null | |
| FK | SublinkId | decimal(14, 0), not null | If of the strand |
| FK | PropertyId | decimal(14, 0), not null | Id of the associated property |
| Value | nvarchar(4000), null | Strand color |
2.3.23 Table: [Sublinks]
This table stores the collection of strands.
2.3.23.1 Structure
| Key | Name | Data Type | Description |
|---|---|---|---|
| PK | Id | decimal(14,0), not null | |
| FK | LinkId | decimal(14,0), not null | Id of the parent link containing the strand |
| Name | nvarchar(4000), null | Name of the strand | |
| FK | FromPortId | decimal(14,0), null | Id of the starting port for the strand |
| FK | ToPortId | decimal(14,0), null | Id of the ending port for the strand |
| FK | PredSublinkId | decimal(14,0), not null | Id of the predefined sublink associated with the link type that produces the strands |
| ExcludeFROMACRA | bit, not null | Flag to determine if sublink should be excluded from any ACRA calculations | |
| Status | tinyint, not null | Strand status value | |
| IsBlockedForPatching | bit, not null | Flag to determine if that strand should be excluded from a patching process | |
| Mode | tinyint, null | Strand mode (inherited from strand type) |
2.3.24 Table: [SublinkSegments]
This table stores the collection of strand segments.
2.3.24.1 Structure
| Key | Name | Data Type | Description |
|---|---|---|---|
| PK | Id | decimal(14,0), not null | |
| FK | SublinkId | decimal(14,0), not null | Id of the parent sublink containing the segment |
| FK | FromPortId | decimal(14,0), null | Id of the starting port for the segment |
| FK | ToPortId | decimal(14,0), null | Id of the ending port for the segment |
| Index | tinyint, not null | ||
| IsBlockedForPatching | bit, not null | Flag to determine if that segment should be excluded from patching |
2.3.25 Table: [Shapes]
This table stores all shape definitions in the netTerrain project.
2.3.25.1 Related ERD
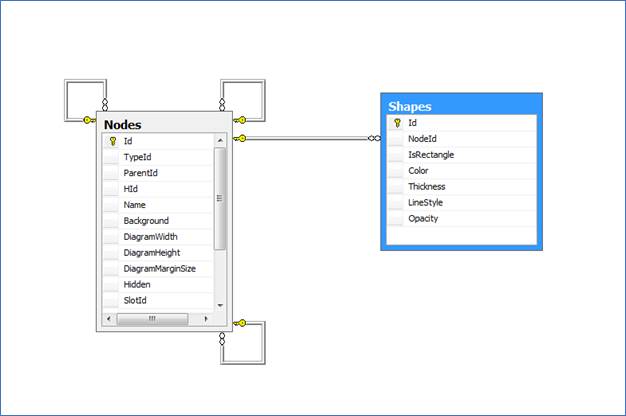
2.3.25.2 Structure
| Key | Name | Data Type | Description |
|---|---|---|---|
| PK | Id | decimal(14,0), not null | |
| FK | NodeId | decimal(14,0), not null | Diagram containing the shape |
| Color | char(7), null | ||
| Thickness | int, null | ||
| LineStyle | int, null | ||
| Opacity | float, null | ||
| ShapeType | int, not null | ||
| Line Color | char(7), null |
2.3.26 Table: [WorkOrders]
This table stores all the work orders created in the project.
2.3.26.1 Structure
| Key | Name | Data Type | Description |
|---|---|---|---|
| PK | Id | decimal(14,0), not null | |
| Name | nvarchar(255), not null | WO name | |
| UserId | decimal(14,0), not null | If of user that owns the WO | |
| DueDate | date, not null | ||
| IsArchived | bit, null | ||
| Read | bit, null | ||
| ReadThatOverdue | bit, null | ||
| Comments | nvarchar(4000), null |
2.3.27 Table: [WorkOrderTasks]
This table stores all the work order tasks created in the project.
2.3.27.1 Structure
| Key | Name | Data Type | Description |
|---|---|---|---|
| PK | Id | decimal(14,0), not null | |
| FK | WorkorderId | decimal(14,0), not null | Parent work order Id |
| Objectid | decimal(14,0), not null | Object associated with the task | |
| Type | tinyint, not null | Type of task (insert, update, delete) | |
| Name | nvarchar(255), not null | Task name | |
| UserId | decimal(14,0), not null | If of user that owns the WO task | |
| DueDate | date, not null | ||
| Status | tinyint, not null | Status of task (due, closed, etc.) | |
| Read | bit, null | ||
| ReadThatOverdue | bit, null | ||
| Comments | nvarchar(4000), null |
2.4 Vis tables
The so called ‘vis’ tables contain the actual representation of netTerrain objects on diagrams. We do not recommend using these tables for data extraction.
2.4.1 Table: [visLinkFields]
2.4.1.1 Structure
| Key | Name | Data Type | Description |
|---|---|---|---|
| PK ,FK | VisLinkId | decimal(14,0), not null | Link described in the table |
| PK ,FK | PropertyValueId | decimal(14,0), not null | Property id of the displayed field |
| OffsetX | float, null | ||
| OffsetY | float, null | ||
| FontSize | int, null | ||
| CanMove | bit, null | ||
| Color | char(7), null | ||
| State | int, not null | ||
| Angle | int, null | ||
| Bold | bit, null | ||
| Italic | bit, null | ||
| Underline | bit, null | ||
| FontFamily | nvarchar(255), null | ||
| BackgroundColor | varchar(7), null | ||
| Align | int, not null | ||
| Anchor | int, not null | ||
| UprightAlignment | bit, not null | ||
| IsNew | bit, not null | ||
| Justification | int, not null | ||
| Id | decimal(14,0), not null |
2.4.2 Table: [visLinks]
2.4.2.1 Structure
| Key | Name | Data Type | Description |
|---|---|---|---|
| PK | Id | decimal(14,0), not null | |
| FK | LinkId | decimal(14,0), not null | Link described in the table |
| FK | DiagramId | decimal(14,0), not null | Diagram containing link (local starting position) |
| IsCurve | bit, null | ||
| Path | nvarchar(max), null | ||
| FromAnchorPointX | float, not null | ||
| FromAnchorPointY | float, not null | ||
| ToAnchorPointX | float, not null | ||
| ToAnchorPointY | float, not null | ||
| CanDelete | bit, null | ||
| CanMove | bit, null | ||
| ZOrder | int, null | ||
| IsHidden | bit, null | ||
| SnappedToEdge | bit, not null |
2.4.3 Table: [visNodeFields]
2.4.3.1 Structure
| Key | Name | Data Type | Description |
|---|---|---|---|
| PK,FK | VisNodeId | decimal(14,0), not null | Node described in the table |
| PK,FK | PropertyValueId | decimal(14,0), not null | Property id of the displayed field |
| OffsetX | float, null | ||
| OffsetY | float, null | ||
| FontSize | int, null | ||
| Color | char(7), null | ||
| CanMove | bit, null | ||
| Angle | int, null | ||
| State | int, not null | ||
| Bold | bit, null | ||
| Italic | bit, null | ||
| Underline | bit, null | ||
| FontFamily | nvarchar(255), null | ||
| BackgroundColor | varchar(7), null | ||
| Align | int, not null | ||
| Justification | int, not null | ||
| Id | decimal(14,0), not null |
2.4.4 Table: [visNodes]
2.4.4.1 Structure
| Key | Name | Data Type | Description |
|---|---|---|---|
| PK | Id | decimal(14,0), not null | |
| NodeId | decimal(14,0), not null | Node described in the table | |
| FK | DiagramId | decimal(14,0), not null | Diagram containing node |
| X | float, null | ||
| Y | float, null | ||
| Width | float, null | ||
| Height | float, null | ||
| KeepAspectRatio | bit, null | ||
| Angle | int, null | ||
| CanMove | bit, null | ||
| CanResize | bit, null | ||
| CanRotate | bit, null | ||
| CanDelete | bit, null | ||
| ZOrder | int, null | ||
| IsHidden | bit, null | ||
| isNew | bit, not null |
2.5 Integration Toolkit (ITK) tables
The ITK tables are a set of tables used to store discovered data and application metadata for the proper functioning of the ITK. The ITK is slowly being replaced by the netTerrain collector, which doesn’t normally persist data in this database, so the use of these tables is going to be very limited moving forward. All ITK tables start with the prefix ‘ada’.
ITK tables contain preprocessed data, before it is reconciled with the core netTerrain tables (such as the Nodes and the Links tables). Even if you use the ITK, we do not recommend consuming data from these tables except for some rare instances (such as reporting of raw data or creating connectors against ITK imported records), instead, refer to the tables that contain instance data.
2.5.1 Table: [adaAppSettings]
This table contains the settings for the ITK, which are set through the ‘Application settings’ dialog in the ITK.
2.5.1.1 Structure
| Key | Name | Data Type |
|---|---|---|
| PK | id | decimal(18,0), not null |
| pollingCycle | nvarchar(255), null | |
| discoveryCycle | nvarchar(255), null | |
| recordsPerPage | int, null | |
| serverUrl | nvarchar(255), null | |
| runUponActivation | nvarchar(255), null | |
| startAt | time(7), null | |
| startOn | nvarchar(255), null | |
| silentMode | nvarchar(255), null | |
| outputBuffer | nvarchar(255), null | |
| genericObjects | nvarchar(255), null |
2.5.2 Table: [adaAwsBuckets]
This table is the first of a series of tables that stores information that the ITK discovers from AWS. The netTerrain collector (which mostly replaces the ITK) has a much more thorough AWS import and monitoring process so the usage of these tables will be limited.
This table collects AWS information about buckets and could be useful to create custom connectors to display AWS buckets in netTerrain.
2.5.2.1 Structure
| Key | Name | Data Type |
|---|---|---|
| PK | Name | nvarchar(255), not null |
| CreationDate | nvarchar(50), null |
2.5.3 Table: [adaAwsHealthChecks]
This table collects AWS information about health checks and could be useful to create custom connectors to display AWS health checks in netTerrain.
2.5.3.1 Structure
| Key | Name | Data Type |
|---|---|---|
| PK | Id | nvarchar(255), not null |
| HealthCheckVersion | nvarchar(255), null | |
| HealthCheckConfig | nvarchar(255), null |
2.5.4 Table: [adaAwsInstances]
This table collects AWS information about discovered AWS instances. The ITK creates a predefined connector for AWS instances when initializing the AWS utility, which imports instances into netTerrain.
2.5.4.1 Structure
| Key | Name | Data Type |
|---|---|---|
| PK | Id | nvarchar(255), not null |
| RegionName | nvarchar(800), null | |
| PublicDnsName | nvarchar(800), null | |
| PrivateDnsName | nvarchar(800), null | |
| PublicIpAddress | nvarchar(800), null | |
| PrivateIpAddress | nvarchar(800), null | |
| NetworkInterfaces | nvarchar(800), null | |
| Platform | nvarchar(800), null | |
| RootDeviceName | nvarchar(800), null | |
| RootDeviceType | nvarchar(800), null | |
| State | nvarchar(800), null | |
| VirtualizationType | nvarchar(800), null | |
| LaunchTime | nvarchar(800), null | |
| KeyName | nvarchar(800), null | |
| Monitoring | nvarchar(800), null | |
| Tag0 | nvarchar(800), null |
2.5.5 Table: [adaAwsRegions]
This table stores the AWS regions.
2.5.5.1 Structure
| Key | Name | Data Type |
|---|---|---|
| PK | Endpoint | nvarchar(255), not null |
| Name | nvarchar(800), null |
2.5.6 Table: [adaAwsSecurityGroups]
This table collects AWS information about security groups and could be useful to create custom connectors to display AWS security groups in netTerrain.
2.5.6.1 Structure
| Key | Name | Data Type |
|---|---|---|
| PK | Id | nvarchar(50), not null |
| GroupName | nvarchar(800), null | |
| VpcId | nvarchar(50), null | |
| Description | nvarchar(800), null |
2.5.7 Table: [adaAwsSecurityGroupsRules]
This table collects AWS information about security group rules and could be useful to create custom connectors to display AWS security group rules in netTerrain.
2.5.7.1 Structure
| Key | Name | Data Type |
|---|---|---|
| PK | GroupId | nvarchar(50), not null |
| Protocol | nvarchar(800), null | |
| PK | IpRanges | nvarchar(255), not null |
| PK | PortRanges | nvarchar(800), not null |
| Type | nvarchar(800), null | |
| Category | nvarchar(800), null |
2.5.8 Table: [adaAwsVolumeAttachments]
This table collects AWS information about volume attachments and could be useful to create custom connectors to display AWS volume attachments in netTerrain.
2.5.8.1 Structure
| Key | Name | Data Type |
|---|---|---|
| PK | VolumeId | nvarchar(50), not null |
| PK | InstanceId | nvarchar(50), not null |
| PK | Device | nvarchar(255), not null |
| AttachTime | nvarchar(255), null | |
| State | nvarchar(50), null |
2.5.9 Table: [adaAwsVolumes]
This table collects AWS information about volumes and could be useful to create custom connectors to display AWS volumes in netTerrain.
2.5.9.1 Structure
| Key | Name | Data Type |
|---|---|---|
| PK | id | nvarchar(50), not null |
| VolumeType | nvarchar(50), not null | |
| AvailabilityZone | nvarchar(800), not null | |
| CreateTime | nvarchar(255), null | |
| Size | nvarchar(50), null | |
| State | nvarchar(50), null | |
| Iops | nvarchar(50), null |
2.5.10 Table: [adaConnectorsources]
This table contains the definitions for node connectors.
2.5.10.1 Structure
| Key | Name | Data Type |
|---|---|---|
| PK | id | decimal(18,0), not null |
| alias | nvarchar(255), null | |
| dbEngine | nvarchar(255), null | |
| serverName | nvarchar(255), null | |
| dbName | nvarchar(255), null | |
| isTrusted | nvarchar(255), null | |
| userName | nvarchar(255), null | |
| pass | nvarchar(255), null | |
| icon | nvarchar(255), null | |
| iconSelected | nvarchar(255), null | |
| enabledFields | nvarchar(255), null | |
| nodeQuery | ntext, null | |
| entityId | decimal(18,0), not null | |
| dsTable | nvarchar(255), null | |
| sourceName | nvarchar(255), null | |
| parentNetworkField | nvarchar(255), null | |
| ntParent | decimal(18,0), null | |
| updates | nvarchar(50), null | |
| inserts | nvarchar(50), null | |
| deletes | nvarchar(50), null | |
| reconciliationField | nvarchar(255), null | |
| statusField | nvarchar(50), null | |
| statusQuery | ntext, null | |
| sequence | smallint, null | |
| dictionaryId | decimal(18,0), null | |
| reconciliationFieldNt | nvarchar(255), null | |
| xcoord | nvarchar(255), null | |
| ycoord | nvarchar(255), null | |
| deviceTypeField | nvarchar(255), null | |
| version | nvarchar(255), null | |
| lastReconciled | datetime2(7), null | |
| lastDiscovered | datetime2(7), null | |
| postImportFunction | nvarchar(4000), null | |
| preImportFunction | nvarchar(4000), null | |
| discoveryOrder | smallint, null | |
| passes | smallint, null | |
| deleteCountThreshold | int, null | |
| pcCode | nvarchar(800), null |
2.5.11 Table: [adaDcmConnectorPropertySet]
The tables that start with the adaDCM prefix store environmental data collected by the netTerrain EM monitoring tool. netTerrain collector (which mostly replaces the ITK) has a much more thorough import and monitoring process for DCM, so the usage of these tables will be limited.
This table is currently not in use.
2.5.11.1 Structure
| Key | Name | Data Type |
|---|---|---|
| uname | nvarchar(255), null | |
| property | nvarchar(255), null | |
| sequence | int, null |
2.5.12 Table: [adaDcmConnectors]
This table is currently not in use.
2.5.12.1 Structure
| Key | Name | Data Type |
|---|---|---|
| PK | id | decmal(18,0), not null |
| uname | nvarchar(255), null | |
| displayName | nvarchar(255), null | |
| description | nvarchar(255), null | |
| type | nvarchar(255), null | |
| version | nvarchar(255), null |
2.5.13 Table: [adaDcmDevices]
This table stores devices discovered via the DCM connector.
2.5.13.1 Structure
| Key | Name | Data Type |
|---|---|---|
| PK | dcmId | nvarchar(255), not null |
| entityId | nvarchar(255), null | |
| DEVICE_MODEL | nvarchar(255), null | |
| CONNECTOR_NAME | nvarchar(255), null | |
| NAMEPLATE_PWR | nvarchar(255), null | |
| DERATED_PWR | nvarchar(255), null | |
| BMC_ADDRESS | nvarchar(255), null | |
| BMC_MAC_ADDRESS | nvarchar(255), null | |
| CAPABILITIES | nvarchar(255), null | |
| ASSET_TAG | nvarchar(255), null | |
| DESCRIPTION | nvarchar(255), null | |
| FIRMWARE_VERSION | nvarchar(255), null | |
| LOCATION | nvarchar(255), null | |
| MAX_POWER_DRAW | nvarchar(255), null | |
| MIN_POWER_DRAW | nvarchar(255), null | |
| NODE_PWR_LIMIT | nvarchar(255), null | |
| PDU_PWR_LIMIT | nvarchar(255), null | |
| SERIAL_NUMBER | nvarchar(255), null | |
| SERVICE_TAG | nvarchar(255), null | |
| TEMPERATURE_UPPER_LIMIT | nvarchar(255), null | |
| AVG_INLET_TEMP | nvarchar(255), null | |
| AVG_CPU_PWR | nvarchar(255), null | |
| AVG_MEM_PWR | nvarchar(255), null | |
| AVG_OUTLET_TEMP | nvarchar(255), null | |
| AVG_PWR | nvarchar(255), null | |
| CPU_USED | nvarchar(255), null | |
| CPU_UTIL | nvarchar(255), null | |
| CUPS | nvarchar(255), null | |
| DISK_IO | nvarchar(255), null | |
| DISK_USED | nvarchar(255), null | |
| ESTIMATED_CPU_USED | nvarchar(255), null | |
| ESTIMATED_DISK_USED | nvarchar(255), null | |
| ESTIMATED_MEMORY_USED | nvarchar(255), null | |
| ESTIMTED_PWR | nvarchar(255), null | |
| INS_PWR | nvarchar(255), null | |
| MAX_AVG_PWR | nvarchar(255), null | |
| MAX_AVG_PWR_CAP | nvarchar(255), null | |
| MAX_CPU_PWR | nvarchar(255), null | |
| MAX_INLET_TEMP | nvarchar(255), null | |
| MAX_MEM_PWR | nvarchar(255), null | |
| MAX_PWR | nvarchar(255), null | |
| MEMORY_USED | nvarchar(255), null | |
| MIC_PWR | nvarchar(255), null | |
| MIN_AVG_PWR | nvarchar(255), null | |
| MIN_CPU_PWR | nvarchar(255), null | |
| MIN_MEM_PWR | nvarchar(255), null | |
| MIN_PWR | nvarchar(255), null | |
| NETWORK_USED | nvarchar(255), null | |
| OBSV_MAX_PDU_PWR | nvarchar(255), null | |
| PDU_PWR | nvarchar(255), null | |
| TOTAL_AVG_PWR | nvarchar(255), null | |
| TOTAL_AVG_PWR_CAP | nvarchar(255), null | |
| TOTAL_MAX_PWR | nvarchar(255), null | |
| TOTAL_MAX_PWR_CAP | nvarchar(255), null | |
| TOTAL_MIN_PWR | nvarchar(255), null |
2.5.14 Table: [adaDcmEntityPropertyNames]
This table is currently not in use.
2.5.14.1 Structure
| Key | Name | Data Type |
|---|---|---|
| PK | entityId | int, not null |
| propertyName0 | nvarchar(255), null | |
| propertyName1 | nvarchar(255), null | |
| propertyName99 | nvarchar(255), null |
2.5.15 Table: [adaDcmEntityPropertyValues]
This table is currently not in use.
2.5.15.1 Structure
| Key | Name | Data Type |
|---|---|---|
| PK | entityId | int, not null |
| propertyName0 | nvarchar(255), null | |
| propertyName1 | nvarchar(255), null | |
| propertyName99 | nvarchar(255), null |
2.5.16 Table: [adaDcmMonitoredPropertySet]
This table stores the properties that the netTerrain environmental monitoring module monitors from DCM enabled devices.
2.5.16.1 Structure
| Key | Name | Data Type |
|---|---|---|
| property | nvarchar(255), not null | |
| ntPropertyName | nvarchar(255), not null | |
| discoveryType | nvarchar(255), not null | |
| status | tinyint, not null |
2.5.17 Table: [adaDevices_1001]
This table stores devices discovered via SNMP, using the native ITK SNMP discovery engine. Since the native SNMP engine only maps discovered devices to smart devices in the netTerrain catalog, in some cases it may be useful to create a connector against this table to turn these devices into nodes. Also, it may be necessary to create a connector against this table when then ancestry string or name field need to be changed, as those are fixed in the predefined SNMP connector present in the ITK. For more information, please check the ITK guide.
2.5.17.1 Structure
| Key | Name | Data Type |
|---|---|---|
| PK | id | int, not null |
| ip_address | nvarchar(50), not null | |
| alias | nvarchar(255), null | |
| DNS | nvarchar(255), null | |
| sysName | nvarchar(255), null | |
| vendor | nvarchar(255), null | |
| lastBoot | nvarchar(255), null | |
| sysUpTime | nvarchar(255), null | |
| sysObjectId | nvarchar(255), null | |
| sysDescr | nvarchar(max), null | |
| sysLocation | nvarchar(max), null | |
| sysContact | nvarchar(max), null | |
| status | nvarchar(255), null | |
| dsId | decimal(18,0), null | |
| lastDiscovered | dateTime, null | |
| icon | smallint, null | |
| iconSelected | smallint, null | |
| enabledFields | nvarchar(255), null | |
| priority | nvarchar(50), null | |
| crudStatus | smallint, null | |
| sysServices | nvarchar(255), null | |
| ifNumber | int, null | |
| baseIpRange | nvarchar(255), null | |
| customOid101 | nvarchar(255), null | |
| .. | nvarchar(255), null | |
| customOid140 | nvarchar(255), null |
2.5.18 Table(s): [adaDevices_1xxx]
An instance of the netTerrain database may have between zero and N additional device tables holding any devices discovered by the ITK against a third-party system via a device connector. Each connector has a four-digit id starting with 1 and the raw data (before reconciled into netTerrain) is stored in a table called adaDevices_1xxx, where 1xxx is the id of that connector.
Since the device connectors map discovered devices to smart devices in the netTerrain catalog, in some cases it may be useful to create a connector against this table to transform these devices into nodes. These tables may also be used as intermediate tables to then query them (for example to concatenate data from the same or other similar tables) and create a connector against the resulting query. For more information, please check the ITK guide.
The structure of these tables will depend on the structure of the source table or query, since these tables are created on the fly, by the ITK.
2.5.18.1 Structure
| Key | Name | Data Type |
|---|---|---|
| PK | nvarchar(255), not null | |
|
|
nvarchar(255), not null | |
| .. | nvarchar(255), not null | |
|
|
nvarchar(255), not null | |
| icon | int null | |
| iconSelected | int null | |
| priority | nvarchar(50), null | |
| crudStatus | smallint null |
2.5.19 Table: [adaEntities]
This table contains metadata related to the representation of connector entities in the ITK interface.
2.5.19.1 Structure
| Key | Name | Data Type |
|---|---|---|
| PK | id | smallint, not null |
| categoryId | decimal(18,0), null | |
| sequence | int, null | |
| isInTree | smallint, null | |
| isAAG | smallint, null | |
| sqlAAGString | nvarchar(max), null | |
| sqlTreeView | nvarchar(max), null | |
| sqlEditString | ntext, null | |
| sqlAddString | nvarchar(max), null | |
| table | nvarchar(50), null | |
| formCaption | nvarchar(255), null | |
| listViewIcon | nvarchar(255), null | |
| menuIcon | nvarchar(255), null | |
| menuItemIndex | int, null | |
| contextMenuStrip | nvarchar(255), null |
2.5.20 Table: [adaFieldMappings]
This table stores the mappings in the ITK between source and netTerrain fields.
2.5.20.1 Structure
| Key | Name | Data Type |
|---|---|---|
| PK | dsId | decimal(18,0), not null |
| PK | sourceField | nvarchar(50), not null |
| PK | destField | nvarchar(50), not null |
2.5.21 Table: [adaFieldRegex]
This table is currently not in use.
2.5.21.1 Structure
| Key | Name | Data Type |
|---|---|---|
| PK | fieldId | decimal(18,0), not null |
| PK | dsId | decimal(18,0), not null |
| regex | nvarchar(max), null |
2.5.22 Table: [adaFields]
This table contains metadata related to the representation of connector fields in the ITK interface.
2.5.22.1 Structure
| Key | Name | Data Type |
|---|---|---|
| PK | id | decimal(18,0), not null |
| PK | id | decimal(18,0), not null |
| entityId | smallint, null | |
| name | nvarchar(255), null | |
| isAAG | smallint, null | |
| AAGSequence | smallint, null | |
| AAGCaption | nvarchar(50), null | |
| AAGWidth | float, null | |
| isEditable | smallint, null | |
| EditSequence | smallint, null | |
| comboSourceEdit | nvarchar(max), null | |
| isDataEntry | smallint, null | |
| comboSourceAdd | nvarchar(max), null | |
| tabPage | smallint, null | |
| allowNulls | smallint, null | |
| defaultValue | nvarchar(255), null | |
| comboBaseTable | nvarchar(50), null | |
| comboBaseEntityId | smallint, null | |
| dependentField | nvarchar(50), null | |
| buttonIndexAdd | int, null | |
| buttonIndexAddCaption | nvarchar(50), null | |
| buttonIndexEdit | int, null | |
| buttonIndexEditCaption | nvarchar(50), null |
2.5.23 Table: [adaLinkersources]
This table contains the definitions for link connectors.
2.5.23.1 Structure
| Key | Name | Data Type |
|---|---|---|
| PK | id | decimal(18,0), not null |
| alias | nvarchar(255), null | |
| dbEngine | nvarchar(255), null | |
| serverName | nvarchar(255), null | |
| dbName | nvarchar(255), null | |
| isTrusted | nvarchar(255), null | |
| userName | nvarchar(255), null | |
| pass | nvarchar(255), null | |
| icon | nvarchar(255), null | |
| iconSelected | nvarchar(255), null | |
| enabledFields | nvarchar(255), null | |
| nodeQuery | ntext, null | |
| entityId | decimal(18,0), not null | |
| dsTable | nvarchar(255), null | |
| dsAlias | nvarchar(255), null | |
| sourceName | nvarchar(255), null | |
| node1 | nvarchar(255), null | |
| node2 | nvarchar(255), null | |
| updates | nvarchar(50), null | |
| inserts | nvarchar(50), null | |
| deletes | nvarchar(50), null | |
| reconciliationField | nvarchar(255), null | |
| statusField | nvarchar(50), null | |
| statusQuery | ntext, null | |
| sequence | smallint, null | |
| dictionaryId | decimal(18,0), null | |
| reconciliationFieldNt | nvarchar(255), null | |
| lastReconciled | datetime2(7), null | |
| lastDiscovered | datetime2(7), null | |
| postImportFunction | nvarchar(4000), null | |
| preImportFunction | nvarchar(4000), null | |
| deleteCountThreshold | int null | |
| separator | nvarchar(255), null | |
| pcCode | nvarchar(800), null |
2.5.24 Table(s): [adaLinks_20xxx]
An instance of the netTerrain database may have between zero and N additional link tables holding any links discovered by the ITK against a third-party system via a link connector. Each link connector has a five-digit id starting with 20 and the raw data (before reconciled into netTerrain) is stored in a table called adaLinks_20xxx, where 20xxx is the id of that connector.
These tables may be used as intermediate tables to then query them (for example to concatenate data from the same or other similar tables) and create a connector against the resulting query. For more information, please check the ITK guide.
The structure of these tables will depend on the structure of the source table or query, since these tables are created on the fly, by the ITK.
2.5.24.1 Structure
| Key | Name | Data Type |
|---|---|---|
| PK | nvarchar(255), not null | |
|
|
nvarchar(255), null | |
| .. | nvarchar(255), null | |
|
|
nvarchar(255), null | |
| icon | int null | |
| iconSelected | int null | |
| priority | nvarchar(50), null | |
| crudStatus | smallint null |
2.5.25 Table: [adaLookups]
This table stores lookup (or helper) data and metadata used by the ITK.
2.5.25.1 Structure
| Key | Name | Data Type |
|---|---|---|
| PK | id | decimal(18,0), not null |
| description | nvarchar(255), not null | |
| PK | category | nvarchar(50), not null |
2.5.26 Table: [adaMappingLibrary]
This table contains the type mappings for device connectors. It is responsible for matching up device types (makes and models) between the custom source table and the netTerrain NodeTypes table.
2.5.26.1 Structure
| Key | Name | Data Type |
|---|---|---|
| PK | id | int, not null |
| sourceTypeName | nvarchar(255), null | |
| destTypeName | nvarchar(255), null | |
| dsId | decimal(18,0), null |
2.5.27 Table: [adaMappingPorts]
This table stores port index information associated with device types mapped in the ITK.
2.5.27.1 Structure
| Key | Name | Data Type |
|---|---|---|
| PK | sourceTypeName | nvarchar(255), not null |
| PK | ifIndex | int, not null |
| PK | destTypeId | decimal(14,0), not null |
| PortId | decimal(14,0), not null |
2.5.28 Table: [adaMappingStatus]
This table maps status values between the source data and netTerrain status values.
2.5.28.1 Structure
| Key | Name | Data Type |
|---|---|---|
| dsId | decimal(18,0), null | |
| destStatusId | decimal(18,0), null | |
| destStatusAlias | nvarchar(255), null | |
| flagIndex | int, null | |
| statusId | nvarchar(255), null | |
| sourceStatusId | nvarchar(255), null |
2.5.29 Table: [adaMappingSuggestions]
This is a helper table used by the ITK to suggest device models associated with a certain sysOID MIB value.
2.5.29.1 Structure
| Key | Name | Data Type |
|---|---|---|
| PK | OID | nvarchar(50), null |
| PK | Model | nvarchar(255), null |
| Vendor | nvarchar(50), null |
2.5.30 Table: [adaMonDatabases]
This table contains the databases discovered by the SQL monitor.
2.5.30.1 Structure
| Key | Name | Data Type |
|---|---|---|
| PK | id | decimal(18,0), not null |
| database_id | decimal(18,0), null | |
| databaseName | nvarchar(255), null | |
| dbServerInstance | nvarchar(255), null | |
| dbEngine | nvarchar(255), null | |
| ntName | nvarchar(255), null | |
| dataFileName | nvarchar(255), null | |
| logFileName | nvarchar(255), null | |
| dataFileSize | float, null | |
| logFileSize | float, null | |
| workStationId | nvarchar(255), null | |
| createDate | nvarchar(255), null |
2.5.31 Table: [adaMonDbServerInstances]
This table contains statistics for all registered SQL instances discovered by the SQL monitor.
2.5.31.1 Structure
| Key | Name | Data Type |
|---|---|---|
| PK | id | decimal(18,0), not null |
| dbServerInstance | nvarchar(255), null | |
| dbEngine | nvarchar(255), null | |
| dbServerVersion | nvarchar(255), null | |
| workstationId | nvarchar(255), null | |
| isTrusted | nvarchar(255), null | |
| userName | nvarchar(255), null | |
| pass | nvarchar(255), null | |
| memOsPhysicalMb | float, null | |
| memOsVirtualMb | float, null | |
| memBufferPoolCommittedMb | float, null | |
| memBufferPoolUsedMb | float, null | |
| memNeededWorkloadMb | float, null | |
| dbProductVersion | nvarchar(255), null | |
| dbProductLevel | nvarchar(255), null | |
| dbEdition | nvarchar(255), null |
2.5.32 Table(s): [adaNetworks_10xxx]
An instance of the netTerrain database may have between zero and N additional node tables holding any nodes discovered by the ITK against a third-party system via a node connector. Each node connector has a five-digit id starting with 10 and the raw data (before reconciled into netTerrain) is stored in a table called adaNodes_10xxx, where 10xxx is the id of that connector.
These tables may be used as intermediate tables to then query them (for example to concatenate data from the same or other similar tables) and create a connector against the resulting query. For more information, please check the ITK guide.
The structure of these tables will depend on the structure of the source table or query, since these tables are created on the fly, by the ITK.
2.5.32.1 Structure
| Key | Name | Data Type |
|---|---|---|
| PK | nvarchar(255), not null | |
|
|
nvarchar(255), null | |
| .. | nvarchar(255), null | |
|
|
nvarchar(255), null | |
| icon | int null | |
| iconSelected | int null | |
| priority | nvarchar(50), null | |
| crudStatus | smallint null |
2.5.33 Table: [adaOctets]
This table contains all registered IP address ranges used by the SNMP discovery engine.
2.5.33.1 Structure
| Key | Name | Data Type |
|---|---|---|
| PK | stringId | nvarchar(255), not null |
| dsId | decimal(18,0), null | |
| firstOctetFrom | smallint, null | |
| secondOctetFrom | smallint, null | |
| thirdOctetFrom | smallint, null | |
| fourthOctetFrom | smallint, null | |
| fourthOctetTo | smallint, null | |
| community | nvarchar(255), null | |
| port | nvarchar(255), null | |
| portMonitoring | nvarchar(255), null | |
| version | nvarchar(255), null | |
| enabled | smallint, null | |
| snmpV3AuthenticationEncryptionFlag | nvarchar(50), null | |
| snmpV3AuthenticationMethod | nvarchar(500), null | |
| snmpV3EncryptionMethod | nvarchar(500), null | |
| snmpV3User | nvarchar(500), null | |
| snmpV3AuthenticationPwd | nvarchar(500), null | |
| snmpV3EncryptionKey | nvarchar(500), null | |
| snmpV3Context | nvarchar(500), null |
2.5.34 Table: [adaOids]
This is a helper table that contains MIB OID to device type mappings. It is used by the native netTerrain SNMP discovery engine to assign the proper device type to a discovered device.
2.5.34.1 Structure
| Key | Name | Data Type |
|---|---|---|
| PK | deviceTypeId | decimal(18,0), not null |
| PK | OID | nvarchar(255), not null |
| OIDname | nvarchar(255), null | |
| deviceFieldName | nvarchar(255), null | |
| priority | int, null |
2.5.35 Table: [adaOidsCustom]
This is a helper table that contains any custom MIB OID to device type mappings. It is used by the native netTerrain SNMP discovery engine to assign custom MIB properties to a discovered device.
2.5.35.1 Structure
| Key | Name | Data Type |
|---|---|---|
| PK | IPRange | nvarchar(255), not null |
| PK | OID | nvarchar(255), not null |
| sourceFieldName | nvarchar(255), not null | |
| ntFieldName | nvarchar(255), not null |
2.5.36 Table: [adaParsers]
This table is currently not in use.
2.5.36.1 Structure
| Key | Name | Data Type |
|---|---|---|
| dsId | decimal(18,0), null | |
| destSourceField | nvarchar(255), null | |
| destSourceTable | nvarchar(255), null | |
| destSourceFilter | nvarchar(255), null | |
| destTargetField | nvarchar(255), null | |
| destTargetTable | nvarchar(255), null | |
| destTargetFilter | nvarchar(255), null | |
| regex | nvarchar(max), null |
2.5.37 Table: [adaPorts]
This table stores the ports discovered by the ITK through an SNMP discovery process.
2.5.37.1 Structure
| Key | Name | Data Type |
|---|---|---|
| PK | id | nvarchar(255), not null |
| ifIndex | int, not null | |
| parentName | nvarchar(255), not null | |
| ifDescr | nvarchar(max), null | |
| ifType | int, null | |
| ifSpeed | decimal(18,0), null | |
| ifPhysAddress | nvarchar(50), not null | |
| ifAdminStatus | smallint, null | |
| ifOperStatus | smallint, null | |
| ifLastChange | nvarchar(255), null |
2.5.38 Table: [adaSettings]
This table contains metadata for the representation of list views in the ITK.
2.5.38.1 Structure
| Key | Name | Data Type |
|---|---|---|
| PK | entityId | decimal(18,0), not null |
| PK | Object | nvarchar(50), not null |
| PK | Property | nvarchar(50), not null |
| Param1 | nvarchar(255), null | |
| Param2 | nvarchar(255), null | |
| Param3 | nvarchar(255), null | |
| Param4 | nvarchar(255), null | |
| Param5 | nvarchar(255), null | |
| Param6 | nvarchar(255), null | |
| Param7 | nvarchar(255), null | |
| Param8 | nvarchar(255), null | |
| Param9 | nvarchar(255), null | |
| Param10 | nvarchar(255), null | |
| Param11 | nvarchar(255), null | |
| Param12 | nvarchar(255), null | |
| Param13 | nvarchar(255), null | |
| Param14 | nvarchar(255), null | |
| Param15 | nvarchar(255), null | |
| Param16 | nvarchar(255), null | |
| Param17 | nvarchar(255), null | |
| Param18 | nvarchar(255), null | |
| Param19 | nvarchar(255), null | |
| Param20 | nvarchar(255), null | |
| Param21 | nvarchar(255), null | |
| Param22 | nvarchar(255), null | |
| Param23 | nvarchar(255), null | |
| Param24 | nvarchar(255), null | |
| Param25 | nvarchar(255), null | |
| Param26 | nvarchar(255), null | |
| Param27 | nvarchar(255), null | |
| Param28 | nvarchar(255), null | |
| Param29 | nvarchar(255), null | |
| Param30 | nvarchar(255), null | |
| Param31 | nvarchar(255), null | |
| Param32 | nvarchar(255), null | |
| Param33 | nvarchar(255), null | |
| Param34 | nvarchar(255), null | |
| Param35 | nvarchar(255), null | |
| Param36 | nvarchar(255), null | |
| Param37 | nvarchar(255), null | |
| Param38 | nvarchar(255), null | |
| Param39 | nvarchar(255), null | |
| Param40 | nvarchar(255), null | |
| Param41 | nvarchar(255), null | |
| Param42 | nvarchar(255), null | |
| Param43 | nvarchar(255), null | |
| Param44 | nvarchar(255), null | |
| Param45 | nvarchar(255), null | |
| Param46 | nvarchar(255), null | |
| Param47 | nvarchar(255), null | |
| Param48 | nvarchar(255), null | |
| Param49 | nvarchar(255), null | |
| Param50 | nvarchar(255), null | |
| Param51 | nvarchar(255), null | |
| Param52 | nvarchar(255), null | |
| Param53 | nvarchar(255), null | |
| Param54 | nvarchar(255), null | |
| Param55 | nvarchar(255), null | |
| Param56 | nvarchar(255), null | |
| Param57 | nvarchar(255), null | |
| Param58 | nvarchar(255), null | |
| Param59 | nvarchar(255), null |
2.5.39 Table: [adaSNMPipAddrTable]
The tables that start with the adaSNMP prefix store SNMP data collected by the ITK SNMP discovery process. netTerrain collector (which mostly replaces the ITK) has a much more thorough import and monitoring process for SNMP, so the usage of these tables will be limited.
This table stores the IP address tables discovered by the ITK through an SNMP discovery process.
2.5.39.1 Structure
| Key | Name | Data Type |
|---|---|---|
| PK | sysNames | nvarchar(255), not null |
| PK | ipAddrEntry | nvarchar(50), not null |
| ipAdEntIfIndex | int, null | |
| ipAdEntNetMask | nvarchar(50), not null |
2.5.40 Table: [adaSNMPipRouteTable]
This table stores the IP routing tables discovered by the ITK through an SNMP discovery process.
2.5.40.1 Structure
| Key | Name | Data Type |
|---|---|---|
| PK | sysNames | nvarchar(255), not null |
| PK | ipRouteDest | nvarchar(50), not null |
| ipRouteIfIndex | int, null | |
| ipRouteMetric1 | int, null | |
| ipRouteNextHop | nvarchar(50), null | |
| ipRouteType | int, null | |
| ipRouteProto | int, null | |
| ipRouteAge | int, null | |
| ipRouteMask | nvarchar(50), null |
2.5.41 Table: [adaSNMPMacForwardingTable]
This table stores the MAC address forwarding tables discovered by the ITK through an SNMP discovery process.
2.5.41.1 Structure
| Key | Name | Data Type |
|---|---|---|
| PK | sysNames | nvarchar(255), not null |
| PK | dot1dTpFdbAddress | nvarchar(50), not null |
| dot1dTpFdbPort | int, null | |
| dot1dTpFdbStatus | int, null |
2.5.42 Table: [adaWMIApplications]
The tables that start with the adaWMI prefix store WMI data collected by the ITK WMI discovery process. netTerrain collector (which mostly replaces the ITK) has a much more thorough import and monitoring process for WMI, so the usage of these tables will be limited.
This table stores, well, the obvious, applications discovered via WMI.
2.5.42.1 Structure
| Key | Name | Data Type |
|---|---|---|
| PK | id | nvarchar(400), not null |
| Host | nvarchar(255), not null | |
| Name | nvarchar(255), not null | |
| Description | nvarchar(max), null | |
| InstallDate | nvarchar(255), null | |
| InstallLocation | nvarchar(255), null | |
| IdentifyingNumber | nvarchar(255), null | |
| SKUNumber | nvarchar(255), null | |
| Vendor | nvarchar(255), null | |
| Version | nvarchar(255), null |
2.5.43 Table: [adaWMIDevices]
This table stores devices that are registered in the ITK for WMI discovery.
2.5.43.1 Structure
| Key | Name | Data Type |
|---|---|---|
| PK | id | int, not null |
| ip_Address | nvarchar(50), null | |
| sysName | nvarchar(255), null | |
| user | nvarchar(255), null | |
| pwd | nvarchar(255), null | |
| DNS | nvarchar(255), null | |
| status | tinyint, null |
2.5.44 Table: [adaWMIDevicesProperties]
This table stores the properties for devices during a WMI discovery process.
2.5.44.1 Structure
| Key | Name | Data Type |
|---|---|---|
| PK | id | int, not null |
| LogicalDrives | nvarchar(max), null | |
| OS | nvarchar(max), null | |
| BIOS | nvarchar(max), null | |
| CPU | nvarchar(max), null | |
| Memory | nvarchar(max), null | |
| Processes | nvarchar(max), null | |
| SystemEnclosure | nvarchar(max), null | |
| ComputerSystem | nvarchar(max), null |
2.5.45 Table: [adaWMIMetaData]
As the name implies, this table stores WMI related metadata, the diverse WMI namespaces used by the ITK during a discovery.
2.5.45.1 Structure
| Key | Name | Data Type |
|---|---|---|
| Namespace | nvarchar(50), null | |
| Class | nvarchar(50), null | |
| Properties | nvarchar(max), null | |
| TemplateId | int, null |
2.5.46 Table: [adaWMINetworkAdapterConf]
This table stores network adapter configuration data discovered via WMI.
2.5.46.1 Structure
| Key | Name | Data Type |
|---|---|---|
| PK | id | nvarchar(400), not null |
| Host | nvarchar(255), not null | |
| Caption | nvarchar(255), not null | |
| DefaultIPGateway | nvarchar(50), null | |
| DHCPServer | nvarchar(255), null | |
| DNSDomain | nvarchar(255), null | |
| DNSHostName | nvarchar(255), null | |
| IPAddress | nvarchar(50), null | |
| MACAddress | nvarchar(50), null |
2.5.47 Table: [adaWMITemplates]
This is another one of those tables that stores WMI related metadata, the WMI categories used by the ITK during a discovery.
2.5.47.1 Structure
| Key | Name | Data Type |
|---|---|---|
| Id | int, not null | |
| Name | nvarchar(50), not null | |
| State | tinyint, not null |
2.5.48 Table: [adaWMIWebsites]
This table stores websites configured in web servers discovered via WMI.
2.5.48.1 Structure
| Key | Name | Data Type |
|---|---|---|
| PK | id | decimal(18,0), not null |
| host | nvarchar(500), not null | |
| path | nvarchar(400), not null | |
| siteName | nvarchar(255), null | |
| applicationPool | nvarchar(max), null | |
| enabledProtocols | nvarchar(255), null | |
| status | nvarchar(255), null | |
| lastResponseTime | float, null | |
| downs | float, null | |
| invalids | float, null | |
| ups | float, null |
2.5.49 Table: [adaWMIWebsitesHistory]
This table stores historical data for website availability related to websites configured in web servers discovered via WMI.
2.5.49.1 Structure
| Key | Name | Data Type |
|---|---|---|
| PK | id | decimal(18,0), not null |
| status | nvarchar(255), not null | |
| PK | timestamp | datetime2(7), not null |
| lastResponseTime | float, null |
2.5.50 Table: [adaXMLParsers]
This is a metadata table that stores regular expressions used in text-based connectors.
2.5.50.1 Structure
| Key | Name | Data Type |
|---|---|---|
| PK | product | nvarchar(50), not null |
| PK | entity | nvarchar(50), not null |
| PK | attribute | nvarchar(50), not null |
| xmlPath | nvarchar(255), null |
3 netTerrain Reports
This chapter provides a guide to creating custom reports for use inside netTerrain, including a description of existing report scripts, the process for creating new custom reports, and tips on how to debug report scripts.
3.1 File location
All reports that are available in netTerrain are located in the following directory:
When creating a new custom report script, you will need to place your SQL file in this folder for netTerrain to be able to pick it up when used inside the netTerrain UI.
3.2 Displaying a report in netTerrain
Reports in netTerrain can be executed by:
-
Double clicking a free text
-
Double clicking on a displayed field
-
Clicking on the property value of an object
-
Double clicking on a node
For all cases above, you need to place a report label and identifier so that it can be executed by netTerrain. For example, by placing the string below in a displayed field, a report can be executed when double clicking on that displayed field:
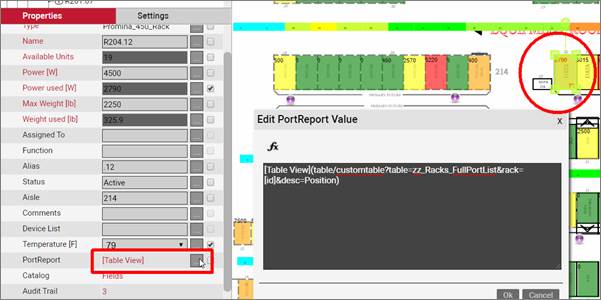
Placing code in a displayed field to launch a report
3.3 Creating a new report
To create a new report in netTerrain you can use an existing pre-built SQL report file or create a new file using any text editor, such as notepad. As mentioned above, these files are placed in the SQLtables folder.
Once your new SQL file is syntactically correct, save it to the SQL reports directory. Use the reports description section as a reference for locating desired information for your report.
3.3.1 The basics
All report scripts must have a unique column that can distinguish records from one another. This column serves as a primary key and must be named “Id” (case sensitive).
Tip
When building a report script, chances are that similar information has been obtained in one of the existing reports below. You could reference the code in the file as a starting point and modify it to your specifications.
When creating a new report, it is important to consider the performance of the query. Slow scripts could slow down the load of netTerrain pages significantly.
3.3.2 Restrictions
Certain restrictions apply to the SQL code placed in reports. These restrictions are put in place to protect the integrity of the netTerrain database.
The SQL syntax for reports is currently limited to SELECT statements. Usage of INSERT, UPDATE, DECLARE or other SQL commands may yield a message such as “BLToolkit.Data.DataException” and follows with an “incorrect syntax…”.
The GO statement is not a SQL statement and is also not allowed in netTerrain reports.
3.3.3 Clickable URLs
To create clickable links in a report in netTerrain, you may use an html hyperlink tag as a series of concatenated string literals for a column. To do this, start by using the tag, which is used to link from one page to another. Then add the HREF attribute to specify the URL destination.
Use the URL reference table below to assist in building a desired URL.
'<a href="../Diagram/'+ CONVERT(varchar, nodes.ParentId) + '?blink=' + CONVERT(varchar, nodes.Id) + '">Show on diagram</a>'
3.3.3.1 URL href reference table from a report location
The table provides a description of the different sections in your code for netTerrain reports.
| Description | Code |
|---|---|
| Diagram and project area | Diagram/[id] |
| Node blinking on diagram to make an object blink | ?blink=[id_of_object_on_diagram] |
| Convert an id to string literal | CONVERT(varchar, nodes.ParentId) |
| Go up one level directory | ../ |
| Admin area URL | AdminConsole/ |
3.3.3.2 Sample case
Here is an example of a report that retrieves a list of netTerrain users and has a modify link which directs to the admin area user management and filters for the specific user id.
SELECT

'<a href="../AdminConsole/Users#page=1{!}filter='+ CONVERT(varchar, u.Id) + '"> Modify ' as url,

u.Id,

u.name

FROM Users u
This is how the report above would appear in netTerrain
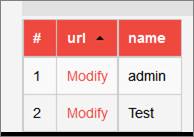
Sample report output
3.4 Debugging reports
This section will discuss common problems that are encountered when executing a built-in or custom report.
A report that is not functioning will encounter a page such as below:
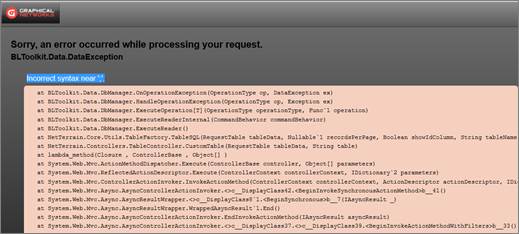
Sample report execution error seen from the netTerrain interface
3.4.1 Common errors
Error Name: GetId
Example Error:
Method 'GetId' in type 'CustomTable635573502859232177' from assembly 'CustomTable635573502859232177, Version=0.0.0.0, Culture=neutral, PublicKeyToken=null' does not have an implementation.
Resolution:
To resolve this problem, verify that at least one column is named ‘Id’ (case-Sensitive).
Error Name: Incorrect syntax near ‘}’
Example Error:
BLToolkit.Data.DataException
Incorrect syntax near '}'.
Resolution:
The report likely has parameters that need to be specified in the URL. You should review the syntax of the report to ensure the parameters are provided values.
Error Name: Syntax restriction
Example Error:
Incorrect syntax near the keyword 'xxx'. Incorrect syntax near ')'.
Resolution:
Reports do not allow non-select statements. To solve this issue, you may have to redesign your report to exclude non SELECT statements.
3.4.2 Report logs
The report logs can be found in:
3.5 Reports Reference
This section will be used as a reference for most of the SQL Reports that are included with netTerrain out-of-the-box. Note that users can create their own reports and throughout releases (or upon request) more can be added, so this reference does not pretend to be 100% comprehensive.
The guide will provide the name, description, syntax, returned columns, examples and notes for every report script.
Below is a summary of all the SQL report references.
- 3.5.1 zz_All_Circuits.sql 126
- 3.5.2 zz_All_Links.sql 127
- 3.5.3 zz_Assets_All.sql 128
- 3.5.4 zz_Assets_Cisco.sql 129
- 3.5.5 zz_Assets_Dell.sql 130
- 3.5.6 zz_Assets_IP_Addresses.sql 131
- 3.5.7 zz_Assets_IP_Addresses_Repeated.sql 133
- 3.5.8 zz_Assets_In_Racks.sql 133
- 3.5.9 zz_Assets_Rackmounted.sql 134
- 3.5.10 zz_Assets_Rackmounted_10_Units_Or_Greater.sql 135
- 3.5.11 zz_Assets_Rackmounted_5_Units_Or_Greater.sql 136
- 3.5.12 zz_Cat_All.sql 137
- 3.5.13 zz_Cat_Cisco.sql 138
- 3.5.14 zz_Cat_Dell.sql 139
- 3.5.15 zz_Cat_HP.sql 140
- 3.5.16 zz_Cat_Juniper.sql 140
- 3.5.17 zz_Cat_NodeOverridesCount.sql 141
- 3.5.18 zz_Cat_Nokia.sql 142
- 3.5.19 zz_Cat_Nortel.sql 143
- 3.5.20 zz_Cat_SlotMappingCountsPerType.sql 143
- 3.5.21 zz_Cat_Sun.sql 144
- 3.5.22 zz_DeviceCardCat.sql 145
- 3.5.23 zz_Devices_With_Connected_Ports.sql 146
- 3.5.24 zz_Diagram_Devices_With_Properties.sql 146
- 3.5.25 zz_Diagrams_Ports_By_PropertyValue.sql 147
- 3.5.26 zz_Diagrams_Top_10_Largest.sql 148
- 3.5.27 zz_Diagrams_Top_50_Largest.sql 149
- 3.5.28 zz_Links_All.sql 150
- 3.5.29 zz_Nodes_Children_IP_Addresses.sql 151
- 3.5.30 zz_Ports.sql 152
- 3.5.31 zz_Ports_Connected.sql 153
- 3.5.32 zz_Ports_Not_Connected.sql 153
- 3.5.33 zz_Racks_Mounted_Devices.sql 155
- 3.5.34 zz_Racks_Port_To_Port_Links.sql 155
- 3.5.35 zz_Report_AuditWeek.sql 156
3.5.1 zz_All_Circuits.sql
Name: zz_All_Circuits
Description: A report that displays all circuits that have been created in the netTerrain project.
Syntax: [Displayed Text](/table/customtable?table=zz_All_Circuits)
Columns:
- URL: Takes the user to the specified diagram where the circuit exists.
- Id: Link id, which is not shown unless the show id field button has been selected.
- Link Type: The type of link.
- Name: The name that was specified for the link.
- End Point 1: Name of the node object at end 1.
- End Point Parent 1: Name of the node's parent at end point 1.
- End Point Type 1: The object type at end point 1.
- End Point 2: Name of the node object at end 2.
- End Point Parent 2: Name of the node's parent at end point 2.
- End Point Type 2: The object type at end point 2
Example:
[All Circuits](/table/customtable?table=zz_All_Circuits)[Report all links](/table/customtable?table=zz_All_Circuits&desc=Name)
Notes:
The second example will order the report in descending order by column "Name".
3.5.2 zz_All_Links.sql
Name: zz_All_Links
Description: A report that displays all links and the starting (source) node to the ending (destination) node.
Syntax: [Displayed Text](/table/customtable?table=zz_All_Links)
Columns:
- Id: Link id, which is not shown unless the show id field button has been selected.
- TypeName: The assigned link type.
- Name: The specified link field property name.
- StartingNode: The name of the starting node.
- EndingNode: The name of the ending node.
Example:
[Report all links](/table/customtable?table=zz_All_Links)[Report all links](/table/customtable?table=zz_All_Links&desc=Name)
Notes:
The second example will order the report in descending order by column "Name".
3.5.3 zz_Assets_All.sql
Name: zz_Assets_All
Description: A report that displays all the assets in the netTerrain project.
Syntax: [Displayed Text](/table/customtable?table=zz_Assets_All)
Columns:
- Id: The node object's id, this column is hidden by default.
- ParentId: The node object's parent id, if one exists.
- TypeName: The node object's assigned type.
- Name: The name of the node object.
- Parent: The name of the parent object.
- Peak Power (W): The peak power that has been set on the object, if the field exists.
- Weight (lb): The weight value on the object, if the field exists.
- Width (in): The width of the object, if the field exists.
- Height (in): The height of the object, if the field exists.
- SlotsOnChassis: The number of slots on the object, if slots exists.
- Free Slots: The number of free slots on the object, if slots exists.
- TotalPorts: The number of ports on the object, if they exists.
- PortsOnChassisOnly: The number of ports on the chassis, if they exists.
Example:
[Report all assets](/table/customtable?table=zz_Assets_All)[Report all assets, order by Name desc](/table/customtable?table=zz_Assets_All&desc=Name)
Notes:
The second example will order the report in descending order by column "Name".
3.5.4 zz_Assets_Cisco.sql
Name: zz_Assets_Cisco
Description: A report that displays all the Cisco assets in the netTerrain project.
Syntax: [Displayed Text](/table/customtable?table=zz_Assets_Cisco)
Columns:
- Id: The node object's id, this column is hidden by default.
- ParentId: The node object's parent id, if one exists.
- TypeName: The node object's assigned type.
- Name: The name of the node object.
- Parent: The name of the parent object.
- Peak Power (W): The peak power that has been set on the object, if the field exists.
- Weight (lb): The weight value on the object, if the field exists.
- Width (in): The width of the object, if the field exists.
- Height (in): The height of the object, if the field exists.
- SlotsOnChassis: The number of slots on the object, if slots exists.
- Free Slots: The number of free slots on the object, if slots exists.
- TotalPorts: The number of ports on the object, if they exists.
- PortsOnChassisOnly: The number of ports on the chassis, if they exists.
Example:
[Report all Cisco assets](/table/customtable?table=zz_Assets_Cisco)[Report all Cisco assets, order by name desc](/table/customtable?table=zz_Assets_Cisco&desc=Name)
Notes:
The second example will order the report in descending order by column "Name".
3.5.5 zz_Assets_Dell.sql
Name: zz_Assets_Dell
Description: A report that displays all the Dell assets in the netTerrain project.
Syntax: [Displayed Text](/table/customtable?table=zz_Assets_Dell)
Columns:
- Id: The node object's id, this column is hidden by default.
- ParentId: The node object's parent id, if one exists.
- TypeName: The node object's assigned type.
- Name: The name of the node object.
- Parent: The name of the parent object.
- Peak Power (W): The peak power that has been set on the object, if the field exists.
- Weight (lb): The weight value on the object, if the field exists.
- Width (in): The width of the object, if the field exists.
- Height (in): The height of the object, if the field exists.
- SlotsOnChassis: The number of slots on the object, if slots exists.
- Free Slots: The number of free slots on the object, if slots exists.
- TotalPorts: The number of ports on the object, if they exists.
- PortsOnChassisOnly: The number of ports on the chassis, if they exists.
Example:
[Report all dell assets](/table/customtable?table=zz_Assets_Dell)[Report all dell assets, order by name desc](/table/customtable?table=zz_Assets_Dell&desc=Name)
Notes:
The second example will order the report in descending order by column "Name".
3.5.6 zz_Assets_IP_Addresses.sql
Name: zz_Assets_IP_Addresses
Description: A report that displays all the assets' IP addresses. The first two parameters will restrict the object field names that contain IP addresses. For a field name to be considered in the result set, the name must contain all of the first and second parameter values. If an object has fields that do not match the specified parameters, they will not be included in the result set. The third parameter will exclude object ids that are smaller than the specified id. A field must contain a valid IPv4 address to be included in the result set.
Syntax: [Displayed Text](table/customtable?table=zz_Assets_IP_Addresses¶m1=<FILTER_FIELD_NAME1>¶m2=<FILTER_FIELD_NAME2>¶m3=<EXCLUDE IDS_SMALLER>)
Columns:
- URL: A URL that will take the user to the asset project location.
- Id: The node object's id, this column is hidden by default.
- IP Address: The IP address that was assigned to the asset.
- Node Type: The object's assigned type.
- Node Name: The object's assigned name.
- Sequence: The IP address sequence number, always in this format: xxxxxxxxx. EX: 192.168.1.5 would be 192168001005
Example:
The following examples assume there are three fields 'Ip1', 'Ip2', and 'Ip Address' that can represent IPs. The following code will generate a report that includes all objects that have a field value that is in IPv4 address format.
Code: [Report all asset ips, all fields with ipv4 address](table/customtable?table=zz_Assets_IP_Addresses¶m1=¶m2=¶m3=0)
The following code will generate a report that includes all objects that have 'ip' in the field name and a value in IPv4 address format. This report would include the following fields: 'Ip1', 'Ip2', and 'Ip Address' - in our case.
[Report all asset ips, with 'ip' in field name](table/customtable?table=zz_Assets_IP_Addresses¶m1=ip¶m2=¶m3=0)
The following code will generate a report that includes all objects that have 'ip' and 'address' in the field name and a value in IPv4 address format.
[Report all asset ips, with 'ip' and 'address' in the field name](table/customtable?table=zz_Assets_IP_Addresses¶m1=ip¶m2=¶m3=0)
The following code will generate a report that includes all objects that have a field value that is in IPv4 address format, and object id greater than 24000000005002
[Report all asset ips, excluding ids smaller than 24000000005002](table/customtable?table=zz_Assets_IP_Addresses¶m1=¶m2=¶m3=24000000005002)
Notes:
- param1: is the first field name filter, any field not containing this value in the field name will be excluded.
- param2: is the second field name filter, any field not containing this value in the field name will be excluded.
- param3: is the id number that excludes any smaller ids from the result set.
3.5.7 zz_Assets_IP_Addresses_Repeated.sql
Name: zz_Assets_IP_Addresses_Repeated
Description: A report that displays all assets with repeating ips.
Syntax: [Displayed Text](table/customtable?table=zz_Assets_IP_Addresses_Repeated)
Columns:
- Id: Used as a row differentiator.
- IP_Count: The number of times the IP is repeated.
- Value: The IP which is being repeated.
Example:
[All IPv4](table/customtable?table=zz_Assets_IP_Addresses_Repeated)[All IPv4, order by ip desc](table/customtable?table=zz_Assets_IP_Addresses_Repeated&desc=Value)
Notes:
The second example will order the report in descending order by column 'Value'
3.5.8 zz_Assets_In_Racks.sql
Name: zz_Assets_In_Racks
Description: A report that shows all assets that are under a rack object. The asset does not have to be mounted.
Syntax: [Displayed Text](table/customtable?table=zz_Assets_In_Racks)
Columns:
- Id: The asset's id, this column is hidden by default.
- ParentId: The asset's parent id (The rack).
- TypeName: The asset configured type.
- Name: The name of the asset.
- Rack: The name of the rack.
- Peak Power (W): The peak power value of the asset.
- Weight (lb): The weight of the asset.
- Width (in): The width of the asset.
- Height (in): The height of the asset.
- SlotsOnChassis: The number of slots on the asset.
- FreeSlots: The number of free slots on the asset.
- TotalPorts: The total ports on the asset.
- PortsOnChassisOnly: The number of ports on the chassis.
Example:
[All assets in racks](table/customtable?table=zz_Assets_In_Racks)[All assets in racks, order by asset name desc](table/customtable?table=zz_Assets_In_Racks&desc=Name)
Notes:
The second example will report all assets ordered by the asset name in descending order.
3.5.9 zz_Assets_Rackmounted.sql
Name: zz_Assets_Rackmounted
Description: A report that shows all assets that are rack mounted.
Syntax: [Displayed Text](table/customtable?table=zz_Assets_Rackmounted)
Columns:
- Id: The asset's id, this column is hidden by default.
- ParentId: The asset's parent id (The rack).
- TypeName: The asset configured type.
- Name: The name of the asset.
- Rack: The name of the rack.
- Peak Power (W): The peak power value of the asset.
- Weight (lb): The weight of the asset.
- Width (in): The width of the asset.
- Height (in): The height of the asset.
- SlotsOnChassis: The number of slots on the asset.
- FreeSlots: The number of free slots on the asset.
- TotalPorts: The total ports on the asset.
- PortsOnChassisOnly: The number of ports on the chassis.
Example:
[All assets in racks](table/customtable?table=zz_Assets_Rackmounted)[All assets in racks, order by asset name desc](table/customtable?table=zz_Assets_Rackmounted&desc=Name)
Notes:
The second example will report all assets ordered by the asset name in descending order.
3.5.10 zz_Assets_Rackmounted_10_Units_Or_Greater.sql
Name: zz_Assets_Rackmounted_10_Units_Or_Greater
Description: The report will show mounted assets that consume 10 or more rack units.
Syntax: [Displayed Text](table/customtable?table=zz_Assets_Rackmounted_10_Units_Or_Greater)
Columns:
- URL: The URL will take users to the diagram where the asset exists.
- Id: The id of the asset, this column is hidden by default.
- ParentId: The asset's parent id (The rack id).
- Device Type: The configured type of the asset.
- Name: The assigned name of the asset.
- Rack: The assigned name of the rack where the asset is mounted.
- Rack Position: The rack unit position of the asset.
- Units Used: The number of rack units consumed.
Example:
[Rackmounted Assets 10 U or greater](table/customtable?table=zz_Assets_Rackmounted_10_Units_Or_Greater)[Rackmounted Assets 10 U or greater, ordered by column name desc](table/customtable?table=zz_Assets_Rackmounted_10_Units_Or_Greater&desc=Name)
Notes:
The second example will report all assets ordered by the asset name in descending order.
3.5.11 zz_Assets_Rackmounted_5_Units_Or_Greater.sql
Name: zz_Assets_Rackmounted_5_Units_Or_Greater
Description: The report will show assets that consume 5 or more rack units.
Syntax: [Displayed Text](table/customtable?table=zz_Assets_Rackmounted_5_Units_Or_Greater)
Columns:
- URL: The URL will take users to the diagram where the asset exists.
- Id: The id of the asset, this column is hidden by default.
- ParentId: The asset's parent id (The rack id).
- Device Type: The configured type of the asset.
- Name: The assigned name of the asset.
- Rack: The assigned name of the rack where the asset is mounted.
- Rack Position: The rack unit position of the asset.
- Units Used: The number of rack units consumed.
Example:
[Rackmounted Assets 5 U or greater](table/customtable?table=zz_Assets_Rackmounted_5_Units_Or_Greater)[Rackmounted Assets 5 U or greater, ordered by column name desc](table/customtable?table=zz_Assets_Rackmounted_5_Units_Or_Greater&desc=Name)
Notes:
The second example will report all assets ordered by the asset name in descending order.
3.5.12 zz_Cat_All.sql
Name: zz_Cat_All
Description: The report will show all the catalog objects.
Syntax: [Displayed Text](table/customtable?table=zz_Cat_All)
Columns:
- Id: The catalog object id, this column is hidden by default.
- Name: The catalog object name.
- SlotCount: The number of modelled slots.
- PortCount: The number of modelled ports.
- Width: The configured width.
- Height: The configured height.
- Description: The description of the node type.
- Category: The type of netTerrain object (Card, Slot, Node, Device)
- Vendor: The configured vendor of the object, if there exists one.
Example:
[All Catalog Objects](table/customtable?table=zz_Cat_All)[All Catalog Objects, order by name desc](table/customtable?table=zz_Cat_All&desc=name)
3.5.13 zz_Cat_Cisco.sql
Name: zz_Cat_Cisco
Description: The report will show all the catalog objects that were manufactured by Cisco.
Syntax: [Displayed Text](table/customtable?table=zz_Cat_Cisco)
Columns:
- Id: The catalog object id, this column is hidden by default.
- Name: The catalog object name.
- SlotCount: The number of modelled slots.
- PortCount: The number of modelled ports.
- Width: The configured width.
- Height: The configured height.
- Description: The description of the node type.
- Category: The type of netTerrain object (Card, Slot, Node, Device)
- Vendor: The configured vendor of the object, if there exists one.
Example:
[All Cisco Catalog Objects](table/customtable?table=zz_Cat_Cisco)[All Cisco Catalog Objects, order by name desc](table/customtable?table=zz_Cat_Cisco&desc=name)
3.5.14 zz_Cat_Dell.sql
Name: zz_Cat_Dell
Description: The report will show all the catalog objects that were manufactured by Dell.
Syntax: [Displayed Text](table/customtable?table=zz_Cat_Dell)
Columns:
- Id: The catalog object id, this column is hidden by default.
- Name: The catalog object name.
- SlotCount: The number of modelled slots.
- PortCount: The number of modelled ports.
- Width: The configured width.
- Height: The configured height.
- Description: The description of the node type.
- Category: The type of netTerrain object (Card, Slot, Node, Device)
- Vendor: The configured vendor of the object, if there exists one.
Example:
[All Dell Catalog Objects](table/customtable?table=zz_Cat_Dell)[All Dell Catalog Objects, order by name desc](table/customtable?table=zz_Cat_Dell&desc=name)
3.5.15 zz_Cat_HP.sql
Name: zz_Cat_HP
Description: The report will show all the catalog objects that were manufactured by HP.
Syntax: [Displayed Text](table/customtable?table=zz_Cat_HP)
Columns:
- Id: The catalog object id, this column is hidden by default.
- Name: The catalog object name.
- SlotCount: The number of moHPed slots.
- PortCount: The number of moHPed ports.
- Width: The configured width.
- Height: The configured height.
- Description: The description of the node type.
- Category: The type of netTerrain object (Card, Slot, Node, Device)
- Vendor: The configured vendor of the object, if there exists one.
Example:
[All HP Catalog Objects](table/customtable?table=zz_Cat_HP)[All HP Catalog Objects, order by name desc](table/customtable?table=zz_Cat_HP&desc=name)
3.5.16 zz_Cat_Juniper.sql
Name: zz_Cat_Juniper
Description: The report will show all the catalog objects that were manufactured by Juniper.
Syntax: [Displayed Text](table/customtable?table=zz_Cat_Juniper)
Columns:
- Id: The catalog object id, this column is hidden by default.
- Name: The catalog object name.
- SlotCount: The number of moJunipered slots.
- PortCount: The number of moJunipered ports.
- Width: The configured width.
- Height: The configured height.
- Description: The description of the node type.
- Category: The type of netTerrain object (Card, Slot, Node, Device)
- Vendor: The configured vendor of the object, if there exists one.
Example:
[All Juniper Catalog Objects](table/customtable?table=zz_Cat_Juniper)[All Juniper Catalog Objects, order by name desc](table/customtable?table=zz_Cat_Juniper&desc=name)
3.5.17 zz_Cat_NodeOverridesCount.sql
Name: zz_Cat_NodeOverridesCount
Description: The report will show the count of configured overrides for a catalog object.
Syntax: [Displayed Text](table/customtable?table=zz_Cat_NodeOverridesCount)
Columns:
- Id: A id number that is necessary, the number has no particular meaning except for ordering.
- Name: The catalog object name.
- Override Count: The number of overrides that exists for this object.
Example:
[Catalog object override count](table/customtable?table=zz_Cat_NodeOverridesCount)[Catalog object override count, order by name desc](table/customtable?table=zz_Cat_NodeOverridesCount&desc=name)
3.5.18 zz_Cat_Nokia.sql
Name: zz_Cat_Nokia
Description: The report will show all the catalog objects that were manufactured by Nokia.
Syntax: [Displayed Text](table/customtable?table=zz_Cat_Nokia)
Columns:
- Id: The catalog object id, this column is hidden by default.
- Name: The catalog object name.
- SlotCount: The number of moNokiaed slots.
- PortCount: The number of moNokiaed ports.
- Width: The configured width.
- Height: The configured height.
- Description: The description of the node type.
- Category: The type of netTerrain object (Card, Slot, Node, Device)
- Vendor: The configured vendor of the object, if there exists one.
Example:
[All Nokia Catalog Objects](table/customtable?table=zz_Cat_Nokia)[All Nokia Catalog Objects, order by name desc](table/customtable?table=zz_Cat_Nokia&desc=name)
3.5.19 zz_Cat_Nortel.sql
Name: zz_Cat_Nortel
Description: The report will show all the catalog objects that were manufactured by Nortel.
Syntax: [Displayed Text](table/customtable?table=zz_Cat_Nortel)
Columns:
- Id: The catalog object id, this column is hidden by default.
- Name: The catalog object name.
- SlotCount: The number of moNorteled slots.
- PortCount: The number of moNorteled ports.
- Width: The configured width.
- Height: The configured height.
- Description: The description of the node type.
- Category: The type of netTerrain object (Card, Slot, Node, Device)
- Vendor: The configured vendor of the object, if there exists one.
Example:
[All Nortel Catalog Objects](table/customtable?table=zz_Cat_Nortel)[All Nortel Catalog Objects, order by name desc](table/customtable?table=zz_Cat_Nortel&desc=name)
3.5.20 zz_Cat_SlotMappingCountsPerType.sql
Name: zz_Cat_SlotMappingCountsPerType
Description: The report will show the count of configured slot mappings per catalog object slot.
Syntax: [Displayed Text](table/customtable?table=zz_Cat_SlotMappingCountsPerType)
Columns:
- Id: A id number that is necessary, the number has no particular meaning except for ordering.
- Device Type: The object name that contains slots.
- Slot Name: The name of the slot.
- Mapping Counts: The number of configured mappings to cards that are compatible with this slot.
Example:
[Catalog object slot card mapping count](table/customtable?table=zz_Cat_SlotMappingCountsPerType)[Catalog object slot card mapping count, order by name desc](table/customtable?table=zz_Cat_SlotMappingCountsPerType&desc=Device Type)
3.5.21 zz_Cat_Sun.sql
Name: zz_Cat_Sun
Description: The report will show all the catalog objects that were manufactured by Sun.
Syntax: [Displayed Text](table/customtable?table=zz_Cat_Sun)
Columns:
- Id: The catalog object id, this column is hidden by default.
- Name: The catalog object name.
- SlotCount: The number of moSuned slots.
- PortCount: The number of moSuned ports.
- Width: The configured width.
- Height: The configured height.
- Description: The description of the node type.
- Category: The type of netTerrain object (Card, Slot, Node, Device)
- Vendor: The configured vendor of the object, if there exists one.
Example:
[All Sun Catalog Objects](table/customtable?table=zz_Cat_Sun)[All Sun Catalog Objects, order by name desc](table/customtable?table=zz_Cat_Sun&desc=name)
3.5.22 zz_DeviceCardCat.sql
Name: zz_DeviceCardCat
Description: The report will provide records of all the devices and cards that exist in netTerrain.
Syntax: [Displayed Text](table/customtable?table=zz_DeviceCardCat)
Columns:
- Id: Node type id, this column is usually hidden by default.
- Model: The name of the Node type
- Width: The configured width amount.
- Height: The configured height amount.
- Category: The category the catalog object falls under, this will be either 'device' or 'card'.
- Description: The configured description of the object.
Example:
[Catalog objects report - device/card](table/customtable?table=zz_DeviceCardCat)[Catalog objects report - device/card, order by model desc](table/customtable?table=zz_DeviceCardCat&desc=model)
3.5.23 zz_Devices_With_Connected_Ports.sql
Name: zz_Devices_With_Connected_Ports
Description: A report of all devices that have a port that has been linked to another.
Syntax: [Displayed Text](table/customtable?table=zz_Devices_With_Connected_Ports)
Columns:
- Id: The id of the node object
- URL: The URL will take users to the diagram where the node object exists.
- Device Type: The assigned catalog type for the node object.
- Device Name: The node object name.
- Parent Diagram: The parent object name of the node object.
- LinkCount: The number of ports on the node object that are connected.
Example:
[Report all devices with connected ports](table/customtable?table=zz_Devices_With_Connected_Ports)
3.5.24 zz_Diagram_Devices_With_Properties.sql
Name: zz_Diagram_Devices_With_Properties
Description: Provides a report of devices and their configured properties. A device will be included regardless of the hierarchy level as long as it's contained in the specified diagram.
Syntax: [Displayed Text](table/customtable?table=zz_Diagram_Devices_With_Properties&diagram=<DIAGRAM_ID>)
Columns:
- Id: This is the id of the device object, the column is hidden by default.
- DeviceName: The assigned device name.
- DeviceType: The assigned device type name from the catalog.
- PropValue: The property name and value.
- Sequence: The sequence, which is the device id and name. The subsequent property field names and values will only show the id, serving as a visual aid.
Example:
[All devices under diagram x](table/customtable?table=zz_Diagram_Devices_With_Properties&diagram=24000000000025)
Notes:
- The report requires a parameter to function, the parameter value is sent via the URL.
- diagram=
3.5.25 zz_Diagrams_Ports_By_PropertyValue.sql
Name: zz_Diagrams_Ports_By_PropertyValue
Description: The report will provide a list of devices and their port status (Open or In-use). The report will be generated by using the following parameters: Rack Id, Port Property Name and Port Property value. Any port not matching the criteria will be excluded.
Syntax: [Displayed Text](table/customtable?table=zz_Diagrams_Ports_By_PropertyValue&Rack=<RACK_ID>
&pname=<Port_Prop_Field_Name>&pvalue=<Port_Prop_Field_Value>)
Columns:
- Link: A URL that will take the user to the diagram where the port exists.
- Id: The port id used by netTerrain.
- Asset Name: The configured asset name.
- Asset Type: The asset's configured catalog type.
- Port Name: The name of the port.
- Status: This is the port status, which is either 'Open' or 'In-use'
Example:
[All Devices with port protocol: power](table/customtable?table=zz_Diagrams_Ports_By_PropertyValue&Rack=24000000000010&pname=protocol&pvalue=power)
Notes:
- The report requires three parameters to function, the parameter value is sent via the >URL in the syntax section above.
- rack: The rack id
- pname: The port property name, which must be matched exactly.
- pvalue: The port property correspoding value, which must be matched exactly.
3.5.26 zz_Diagrams_Top_10_Largest.sql
Name: zz_Diagrams_Top_10_Largest
Description: A report showing the top 10 largest diagrams.
Syntax: [Displayed Text](table/customtable?table=zz_Diagrams_Top_10_Largest)
Columns:
- Link: This URL will take the user to the diagram location.
- Id: The diagram id, which is hidden by default.
- ParentId: The parent id of the node or diagram.
- TypeName: The configured catalog type for the node/diagram.
- Name: The name of the node or diagram.
- Parent: The parent object name.
- NodeCount: The number of nodes on the diagram.
Example:
[Top 10 largest diagrams](table/customtable?table=zz_Diagrams_Top_10_Largest)[Top 10 largest diagrams, sort by diagram size desc](table/customtable?table=zz_Diagrams_Top_10_Largest&desc=NodeCount)[Top 10 largest diagrams, sort by diagram size asc](table/customtable?table=zz_Diagrams_Top_10_Largest&asc=NodeCount)
3.5.27 zz_Diagrams_Top_50_Largest.sql
Name: zz_Diagrams_Top_50_Largest
Description: A report showing the top 50 largest diagrams.
Syntax: [Displayed Text](table/customtable?table=zz_Diagrams_Top_50_Largest)
Columns:
- Link: This URL will take the user to the diagram location.
- Id: The diagram id, which is hidden by default.
- ParentId: The parent id of the node or diagram.
- TypeName: The configured catalog type for the node/diagram.
- Name: The name of the node or diagram.
- Parent: The parent object name.
- NodeCount: The number of nodes on the diagram.
Example:
[Top 50 largest diagrams](table/customtable?table=zz_Diagrams_Top_50_Largest)
[Top 50 largest diagrams, sort by diagram size desc](table/customtable?table=zz_Diagrams_Top_50_Largest&desc=NodeCount)
[Top 50 largest diagrams, sort by diagram size asc](table/customtable?table=zz_Diagrams_Top_50_Largest&asc=NodeCount)
3.5.28 zz_Links_All.sql
Name: zz_Links_All
Description: Provides a report on all the logical links between nodes (port links are not considered).
Syntax: [Displayed Text](table/customtable?table=zz_Links_All)
Columns:
- URL: The URL will take the user to the diagram where the link exists.
- Id: The id of the link, this column is hidden by default.
- Link Type: The configured link type.
- Name: The configured name for the link.
- End Point 1: The name of the node at side one of the link.
- End Point Parent 1: The name of the parent node at side one.
- End Point Type 1: The type of node at side one.
- End Point 2: The name of the node at side two of the link.
- End Point Parent 2: The name of the parent node at side two.
- End Point Type 2: The type of node at side two.
Example:
[All Logical Links](table/customtable?table=zz_Links_All)[All Logical Links, order by link name desc](table/customtable?table=zz_Links_All&desc=Name)
3.5.29 zz_Nodes_Children_IP_Addresses.sql
Name: zz_Nodes_Children_IP_Addresses
Description: The report will show all the node children IP addresses. Only nodes that satisfy the following criterion will be included: At least one of the node's property field names contain all of both 'pname1' and 'pname2' parameter values. The node id number must be greater than the specified 'nid' number.
Syntax: [Displayed Text](table/customtable?table=zz_Nodes_Children_IP_Addresses&pname1=<Partial_Property_Name>&pname2=<Partial_Property_Name>&nid=<Greater_Than_ID>)
Columns:
- URL: The URL will take the user to the diagram where the node exists.
- Id: The id of the node, this column is hidden by default.
- IP Address: The IPv4 address of the node
- Node Type: The configured type for the node.
- Node Name: The assigned name of the node.
- Sequence: The IPv4 sequence number, which is in the format: xxxxxxxxx. So 192.168.1.1 would appear as 192168001001
Example:
[All Nodes children IP addresses](table/customtable?table=zz_Nodes_Children_IP_Addresses&pname1=&pname2=&nid=0)[All Logical Links, order by link name desc](table/customtable?table=zz_Nodes_Children_IP_Addresses&desc=Name)
Notes:
- The report requires three parameters to be specified in order to function, the >parameter value is sent via the URL in the syntax section above.
- pname1: Partial match for the node property name, leave blank to match all.
- pname2: Partial match for the node property name, leave blank to match all.
- nid:Only ids greater than the specified will be included in the result set. Use 0 to include all.
3.5.30 zz_Ports.sql
Name: zz_Ports
Description: The report shows all the ports that exist in the netTerrain project.
Syntax: [Displayed Text](table/customtable?table=zz_Ports)
Columns:
- URL: Takes the user to the diagram where the port exists.
- Id: The id of the node's port.
- Container: The node object's parent name.
- Device: The name of the object which contains the port.
- Card: The name of the card object which contains the port, if there exists one.
- Port Name: The name of the port.
- Status: The port's property status field value, if there exists one.
- Connector: The port's property connector field value, if there exists one.
- Protocol: The port's property protocol field value, if there exists one.
- Connection Count: The number of links made to this port.
Example:
[Report All Ports](table/customtable?table=zz_Ports)>
3.5.31 zz_Ports_Connected.sql
Name: zz_Ports_Connected
Description: The report shows all the ports which have been linked to another object/port.
Syntax: [Displayed Text](table/customtable?table=zz_Ports_Connected)
Columns:
- URL: The link will take users to where the port exists.
- Id: The id of the port, the column is hidden by default.
- Container: The node's parent container.
- Device: The name of the object which contains the port.
- Card: The card on the node object where the port is located, if one exists.
- Port Name: The name configured for the port.
- Status: The port's property status field value, if there exists one.
- Connector: The port's property connector field value, if there exists one.
- Protocol: The port's property protocol field value, if there exists one.
- Connection Count: The number of links made to this port.
Example:
[Ports Connected](table/customtable?table=zz_Ports_Connected)
3.5.32 zz_Ports_Not_Connected.sql
Name: zz_Ports_Not_Connected
Description: The report will show all the ports which have no connection/link.
Syntax: [Displayed Text](table/customtable?table=zz_Ports_Not_Connected)
Columns:
- URL: The link will take users to where the port exists.
- Id: The id of the port, the column is hidden by default.
- Container: The node's parent container.
- Device: The name of the object which contains the port.
- Card: The card on the node object where the port is located, if one exists.
- Port Name: The name configured for the port.
- Status: The port's property status field value, if there exists one.
- Connector: The port's property connector field value, if there exists one.
- Protocol: The port's property protocol field value, if there exists one.
- Connection Count: The number of links made to this port.
Example:
[Ports Not Connected](table/customtable?table=zz_Ports_Not_Connected)
3.5.33 zz_Ports_VLANs.sql
Name: zz_Ports_VLANs
Description: The report will show all the Collector SNMP discovered VLANs associated with the port index.
Syntax: [Displayed Text](table/customtable?table=zz_Ports_VLANs&id=<id>)
Columns:
- Id: The id of the port, the column is hidden by default.
- Vlan: Vlan number.
- Mac Address: Port physical address
- Port Index: Port Index, as per catalog mapped index. Usually the SNMP ifIndex
- Device: The name of the object which contains the port.
- Port Name: The name configured for the port.
Example:
[VLANs](table/customtable?table=zz_Ports_VLANs&id=[id])
3.5.34 zz_Racks_Mounted_Devices.sql
Name: zz_Racks_Mounted_Devices
Description: The report will show all devices mounted on a specified rack. You must use the parameter 'rack' to pass an id value to the report.
Syntax: [Displayed Text](table/customtable?table=zz_Racks_Mounted_Devices&rack=<RACK_ID>) [Mounted Devices on Rack X](table/customtable?table=zz_Racks_Mounted_Devices&rack=24000000000010)
Columns:
- Id: The id of the node object,
- DeviceName: The name of the mounted device.
- Property: A property field of the mounted device.
- RecordIndex: The id of the device and for the first record also the device name.
Notes:
- The report requires one parameter to be specified in order to function, the parameter >value is sent via the URL in the syntax section above.
- Rack: The rack id where the mounted devices exists.
3.5.35 zz_Racks_Port_To_Port_Links.sql
Name: zz_Racks_Port_To_Port_Links
Description: The report will show all port connections on the specified rack.
Syntax: [Displayed Text](table/customtable?table=zz_Racks_Port_To_Port_Links&rack=<RACK_ID>)
Columns:
- Id: The id of the link, this column is hidden by default.
- Rack: The name of the rack.
- Local Device: The device where the link is connected to.
- Local Card: The device's card name if applicable.
- Local Port: The assigned port name.
- Remote Rack: The rack name of the other end of the link.
- Remote Device: The remote device name of the other end of the link.
- Remote Card: The device's card name if applicable.
- Remote Port: The port name of the other end of the link.
- Link Name: The link name of the connection.
Example:
[Racks port to port connections](table/customtable?table=zz_Racks_Port_To_Port_Links&rack=24000000000010)
Notes:
- The report requires one parameter to be specified in order to function, the parameter value is sent via the URL in the syntax section above.
- Rack: The rack id where the link exists.
3.5.36 zz_Report_AuditWeek.sql
Name: zz_Report_AuditWeek
Description: Provides an audit report of all user actions that occurred in the previous week.
Syntax: [Displayed Text](table/customtable?table=zz_Report_AuditWeek)
Columns:
- URL: If applicable the diagram id.
- Id: The audit record id.
- Object ID: The affected object id.
- Object Parent ID: If applicable, the object's parent id.
- Action: The type of action that was taken place i.e
- Timestamp: Date and time of the action or event.
Example:
[Audit for week](table/customtable?table=zz_Report_AuditWeek)
4 netTerrain Expressions
Expressions in netTerrain are aggregate SQL functions that exist in the application server. These functions retrieve a scalar value based on the expression query, for example the number of nodes in the project.
netTerrain 5.2 or better ships with several predefined functions, and advanced users can also create their own expressions and put them in the SQLexpressions folder on the server.
These expressions will then be available to the client and can be displayed on the properties window or on the diagram as a displayed field.
In this chapter we discuss the process of creating new expressions and we also provide a reference for existing expressions that are shipped with the product.
4.1 File location
All expressions that are available in netTerrain are in the following folder:
%install_dir%\Graphical Networks\netTerrain\vis\SQLExpressions
When creating a new expression script, you will need to place your SQL file in this folder for it to appear as an option in netTerrain.
4.2 Reserved parameters
netTerrain currently contains three reserved parameters, which can be used in SQL expressions. These are:
- [userId]: the current user's id.
- [id]: current object id (where the expression is run from)
- [DiagramId]: current object's diagram location.
4.3 Using expressions in netTerrain
Expressions can be used in free text, displayed fields or property values.
To use an expression, type it on the properties field directly if you know the syntax, or retrieve it from the field editor by clicking on the ‘Exp’ button as shown below.
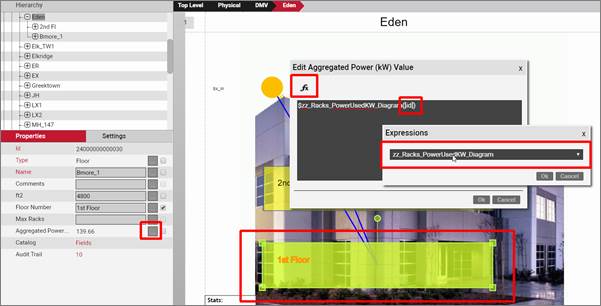
Adding an expression to a field
The example above, shows a node, for which the field ‘AggregateValue’ will display an expression consisting of the total number of nodes in the project and also display that value on the diagram. The property field uses the following syntax: ‘Total nodes: $zz_Proj_TotalNodeCount’
The result is a value such as ‘Total nodes: 903’ as displayed below.
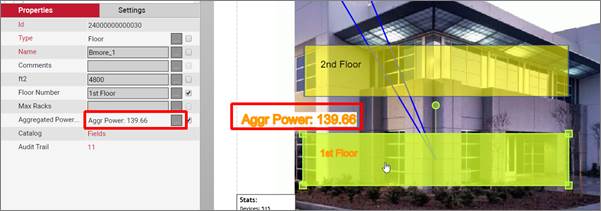
Result of the expression
In general, an expression has the following syntax pattern:
4.4 Creating custom expressions
First begin by creating a new SQL file and when complete, save it to the SQL reports directory. Use the reports description section above as a reference for locating desired information for your report.
4.4.1 The basics
An expression in netTerrain is a scalar producing query, which means only a single value should be returned. In this section we will show how to create your own SQL expression.
Tip:
When building an expression script, chances are that similar information has been obtained in one of the existing expressions below. You could reference the code in the file as a starting point and modify it to your specifications.
When creating a new expression, it is important to consider the performance of the query. Slow scripts could increase the load time of netTerrain diagrams significantly.
4.4.2 Parameters
In the SQL code you may use curly tags to retrieve parameter values. They start with {0}, {1}, {2} and so on for each additional parameter value being sent.
The following code shows three parameters being sent:
$zz_Demo(‘param’, 2, 5)
This is how the parameters would appear after execution:
4.4.3 Sample case
In our example we would like to show the number of objects on a specified diagram.
We know that all node objects are held in the Nodes table and we would like to count the number of objects whose parent is x.
The SQL code would appear as:
Notice that we are returning one column and one record by using the COUNT function.
4.5 Expressions Reference
This section provides a reference for most of the predefined SQL Expressions that are included in netTerrain. Note that users can create their own expressions and throughout releases (or upon request) more can be added, so this reference does not pretend to be 100% comprehensive.
The guide provides the name, description, syntax, example and notes for every expression script. Below is a summary of all the expressions.
- 4.5.1 ParamsExample.sql165
- 4.5.2 zz_Audit_CurrentUserId.sql166
- 4.5.3 zz_Audit_GetDate.sql166
- 4.5.4 zz_Audit_GetDate2.sql167
- 4.5.5 zz_Audit_GetDateTime.sql168
- 4.5.6 zz_Audit_GetDateTime2.sql168
- 4.5.7 zz_Audit_InsertAuthor.sql169
- 4.5.8 zz_Audit_InsertDate.sql169
- 4.5.9 zz_Audit_InsertDate2.sql169
- 4.5.10 zz_Audit_InsertDateTime.sql170
- 4.5.11 zz_Audit_InsertDateTime2.sql170
- 4.5.12 zz_Audit_LastUpdateDate.sql171
- 4.5.13 zz_Audit_LastUpdateDate2.sql172
- 4.5.14 zz_Audit_LastUpdateDateTime.sql172
- 4.5.15 zz_Audit_LastUpdateDateTime2.sql173
- 4.5.16 zz_Audit_TotalDeletes.sql173
- 4.5.17 zz_Audit_TotalDeletesCurrentUser.sql174
- 4.5.18 zz_Audit_TotalEntries.sql174
- 4.5.19 zz_Audit_TotalEntriesCurrentUser.sql175
- 4.5.20 zz_Audit_TotalInserts.sql175
- 4.5.21 zz_Audit_TotalInsertsCurrentUser.sql176
- 4.5.22 zz_Audit_TotalUpdates.sql176
- 4.5.23 zz_Audit_TotalUpdatesCurrentUser.sql177
- 4.5.24 zz_Dash_Cards_OccupancyPerc.sql177
- 4.5.25 zz_Dash_Cards_TotalCount.sql178
- 4.5.26 zz_Dash_Comments_TotalCount.sql178
- 4.5.27 zz_Dash_Devices_CardUtilization.sql179
- 4.5.28 zz_Dash_Devices_PortUtilization.sql179
- 4.5.29 zz_Dash_Devices_TotalCount.sql180
- 4.5.30 zz_Dash_Devices_TotalCountByModelId.sql180
- 4.5.31 zz_Dash_Devices_TotalCountByStatusValue.sql181
- 4.5.32 zz_Dash_Diagrams_1000_Nodes.sql181
- 4.5.33 zz_Dash_Diagrams_100_To_249_Nodes.sql182
- 4.5.34 zz_Dash_Diagrams_1_To_49_Nodes.sql182
- 4.5.35 zz_Dash_Diagrams_250_To_499_Nodes.sql183
- 4.5.36 zz_Dash_Diagrams_500_To_999_Nodes.sql183
- 4.5.37 zz_Dash_Diagrams_50_To_99_Nodes.sql183
- 4.5.38 zz_Dash_Diagrams_TotalCount.sql184
- 4.5.39 zz_Dash_Documents_TotalCount.sql184
- 4.5.40 zz_Dash_Links_TotalCount.sql185
- 4.5.41 zz_Dash_Nodes_TotalCount.sql185
- 4.5.42 zz_Dash_Palette_TotalCount.sql185
- 4.5.43 zz_Dash_Ports_TotalCount.sql186
- 4.5.44 zz_Dash_Racks_PowerInUsePerc.sql186
- 4.5.45 zz_Dash_Racks_PowerUsed.sql187
- 4.5.46 zz_Dash_Racks_PowerUsedKW.sql187
- 4.5.47 zz_Dash_Racks_RUsInUsePerc.sql188
- 4.5.48 zz_Dash_Racks_RUsUsed.sql188
- 4.5.49 zz_Dash_Racks_TotalCount.sql188
- 4.5.50 zz_Dash_Racks_TotalPower.sql189
- 4.5.51 zz_Dash_Racks_TotalPowerAvailable.sql189
- 4.5.52 zz_Dash_Racks_TotalRUs.sql190
- 4.5.53 zz_Dash_Racks_TotalWeight.sql190
- 4.5.54 zz_Dash_Racks_TotalWeightAvailable.sql191
- 4.5.55 zz_Dash_Racks_WeightInUsePerc.sql191
- 4.5.56 zz_Dash_Racks_WeightUsed.sql192
- 4.5.57 zz_Dash_Racks_kBTUH.sql192
- 4.5.58 zz_Dash_Shapes_TotalCount.sql193
- 4.5.59 zz_Dash_Slots_TotalCount.sql193
- 4.5.60 zz_Dash_Stamps_TotalCount.sql194
- 4.5.61 zz_Dcm_PowerPerRackAvgKW.sql194
- 4.5.62 zz_Dcm_PowerPerRackDeratedKW.sql195
- 4.5.63 zz_Dcm_PowerPerRackMaxDrawKW.sql195
- 4.5.64 zz_Dcm_TemperatureInletPerRackAvgC.sql196
- 4.5.65 zz_Device_GetPortCountByPropertyValue.sql196
- 4.5.66 zz_Device_Power_Derated.sql197
- 4.5.67 zz_Device_kBTUH.sql197
- 4.5.68 zz_Diagram_GetDeviceCount.sql198
- 4.5.69 zz_Diagram_GetPortCount.sql198
- 4.5.70 zz_Diagram_GetPortCountByPropertyValue.sql199
- 4.5.71 zz_ITK_AdaptersCount.sql199
- 4.5.72 zz_ITK_ConnectorsCount.sql199
- 4.5.73 zz_ITK_DeviceConnectorCount.sql200
- 4.5.74 zz_ITK_LinkersCount.sql200
- 4.5.75 zz_ITK_Mon_Databases_Count_Active.sql201
- 4.5.76 zz_ITK_Mon_Databases_Count_Inactive.sql201
- 4.5.77 zz_ITK_Mon_Databases_Count_Unknown.sql201
- 4.5.78 zz_ITK_Mon_Databases_DataFileSize_Active.sql202
- 4.5.79 zz_ITK_Mon_Databases_DataFileSize_Inactive.sql202
- 4.5.80 zz_ITK_Mon_Databases_DataFileSize_Unknown.sql202
- 4.5.81 zz_ITK_Mon_Databases_LogFileSize_Active.sql203
- 4.5.82 zz_ITK_Mon_Databases_LogFileSize_Inactive.sql203
- 4.5.83 zz_ITK_Mon_Databases_LogFileSize_Unknown.sql204
- 4.5.84 zz_Link_GetCountByPropertyAndValue_ExactMatch.sql204
- 4.5.85 zz_Link_GetCountByPropertyAndValue_PartialMatch.sql205
- 4.5.86 zz_Link_GetCountByTypeAndPropertyAndValue_ExactMatch.sql206
- 4.5.87 zz_Link_GetCountByTypeAndPropertyAndValue_PartialMatch.sql206
- 4.5.88 zz_Link_GetCountByTypeAndValue_ExactMatch.sql207
- 4.5.89 zz_Link_GetCountByTypeAndValue_PartialMatch.sql208
- 4.5.90 zz_Link_GetCountByType_ExactMatch.sql209
- 4.5.91 zz_Link_GetCountByType_PartialMatch.sql210
- 4.5.92 zz_Link_GetCountByValue_ExactMatch.sql210
- 4.5.93 zz_Link_GetCountByValue_PartialMatch.sql211
- 4.5.94 zz_Link_LinkEndingPoint.sql212
- 4.5.95 zz_Link_LinkEndingPortConnector.sql212
- 4.5.96 zz_Link_LinkEndingPortProtocol.sql213
- 4.5.97 zz_Link_LinkEndingPortStatus.sql213
- 4.5.98 zz_Link_LinkName .sql214
- 4.5.99 zz_Link_LinkStartingPoint.sql214
- 4.5.100 zz_Link_LinkStartingPortConnector.sql215
- 4.5.101 zz_Link_LinkStartingPortProtocol.sql215
- 4.5.102 zz_Link_LinkStartingPortStatus.sql216
- 4.5.103 zz_Link_Name .sql216
- 4.5.104 zz_Link_ValueByPropertyName.sql217
- 4.5.105 zz_Misc_Date.sql217
- 4.5.106 zz_Node_CountChildren.sql217
- 4.5.107 zz_Node_CountChildrenFullSubtree.sql218
- 4.5.108 zz_Node_CountDocuments.sql218
- 4.5.109 zz_Node_CountLinksConnected.sql219
- 4.5.110 zz_Node_GetAncestorFieldValue.sql219
- 4.5.111 zz_Node_GetCountByPropertyAndValue_ExactMatch.sql220
- 4.5.112 zz_Node_GetCountByPropertyAndValue_PartialMatch.sql220
- 4.5.113 zz_Node_GetCountByTypeAndPropertyAndValue_ExactMatch.sql221
- 4.5.114 zz_Node_GetCountByTypeAndPropertyAndValue_PartialMatch.sql221
- 4.5.115 zz_Node_GetCountByTypeAndValue_ExactMatch.sql222
- 4.5.116 zz_Node_GetCountByTypeAndValue_PartialMatch.sql222
- 4.5.117 zz_Node_GetCountByType_ExactMatch.sql222
- 4.5.118 zz_Node_GetCountByType_ExactMatch_WithSearchUrl.sql223
- 4.5.119 zz_Node_GetCountByType_PartialMatch.sql223
- 4.5.120 zz_Node_GetCountByValue_ExactMatch.sql224
- 4.5.121 zz_Node_GetCountByValue_PartialMatch.sql224
- 4.5.122 zz_Node_GetValueByPropertyName.sql225
- 4.5.123 zz_Node_IP_addresses_Children.sql225
- 4.5.124 zz_Node_MultiValuesByFieldNameInOneField.sql226
- 4.5.125 zz_Node_Name.sql226
- 4.5.126 zz_Node_ParentName.sql227
- 4.5.127 zz_Node_RackPosition.sql227
- 4.5.128 zz_Node_Type.sql227
- 4.5.129 zz_Node_getCheckedFieldNames.sql228
- 4.5.130 zz_Object_Id.sql229
- 4.5.131 zz_Port_DeviceParentName.sql229
- 4.5.132 zz_Port_RackDevicePortPath.sql230
- 4.5.133 zz_Ports_UsedPortsOnDevice.sql230
- 4.5.134 zz_Project_GenericNodeCount.sql231
4.5.1 ParamsExample.sql
Name: $ParamsExample
Description: This expression will reveal the current reserved parameters available for use. The curly tags {0}, {1}, and so on are the params that are being passed to the script.
Syntax: $ParamsExample(<param0>,<param1>, <param2>, <param3>)
Example:
- Usage:
$ParamsExample([id],[userId],'some text',[DiagramId])- Sample output:
id=24000000031862; userid=94000000000171; text=some text; number=24000000014087;
Notes:
- [userId] - The current user's id.
- [id] - Current object id (Where the expression is run from)
- [DiagramId] - Current object's diagram location.
- A parameter can be a number, a string or a reserved param, such as those above.
4.5.2 zz_Audit_CurrentUserId.sql
Name: $zz_Audit_CurrentUserId
Description: The expression will return the current user's id.
Syntax: $zz_Audit_CurrentUserId([UserId])
Example:
- Using: $zz_Audit_CurrentUserId([userId])
- Sample output: '94000000000004'
Notes:
- This expression is most useful in conjunction with other functions or reports that take the UserId as an input.
4.5.3 zz_Audit_GetDate.sql
Name: $zz_Audit_GetDate
Description: The expression will return the system's current date in the following format mm/dd/yyyy. For another format see $zz_Audit_GetDate2
Syntax: $zz_Audit_GetDate()
Example:
- Using: $zz_Audit_GetDate()
- Sample output: 12/22/2014
Notes:
- The expression can be useful when exporting diagrams and noting the time it was exported.
4.5.4 zz_Audit_GetDate2.sql
Name: $zz_Audit_GetDate2
Description: Returns the system's date in the following format: DD.Month.YYYY
Syntax: $zz_Audit_GetDate2()
Example:
- Using: $zz_Audit_GetDate2()
- Sample output: 22.December.2014
Notes:
- The expression can be useful when exporting diagrams and noting the date it was exported.
4.5.5 zz_Audit_GetDateTime.sql
Name: $zz_Audit_GetDateTime
Description: Gets the current date and time in MM/DD/YYYY HH:MM:SS AM Format.
Syntax: $zz_Audit_GetDateTime()
Example:
- Using: $zz_Audit_GetDateTime()
- Sample output: 3/20/2014 9:56:52 PM
Notes:
- Also see $zz_Audit_GetDateTime2 for a different format
4.5.6 zz_Audit_GetDateTime2.sql
Name: $zz_Audit_GetDateTime2
Description: Gets the current date and time in DD.Month Name.yyyy :: 24-hour clock format.
Syntax: $zz_Audit_GetDateTime2()
Example:
- Using: $zz_Audit_GetDateTime2()
- Sample output: 24.December.2014 :: 17:20
Notes:
- See $zz_Audit_GetDateTime for a different format.
4.5.7 zz_Audit_InsertAuthor.sql
Name: $zz_Audit_InsertAuthor
Description: Gets the name of the object's creator. If there is none, then '
Syntax: $zz_Audit_InsertAuthor([id]) or $zz_Audit_InsertAuthor('24000000099864')
Example:
- Using: $zz_Audit_InsertAuthor([id])
- Sample output: John.Doe
4.5.8 zz_Audit_InsertDate.sql
Name: $zz_Audit_InsertDate
Description: Gets the object's insert date or returns '
Syntax: $zz_Audit_InsertDate([id])
Example:
- Using: $zz_Audit_InsertDate([id])
- Sample output: 12/22/2014
Notes:
- See $zz_Audit_InsertDate2 for a different date format.
4.5.9 zz_Audit_InsertDate2.sql
Name: $zz_Audit_InsertDate2
Description: Gets the object's insert date or returns '
Syntax: $zz_Audit_InsertDate2([id])
Example:
- Using: $zz_Audit_InsertDate2([id])
- Sample output: 22.December.2014
Notes:
- See $zz_Audit_InsertDate for a different date format.
4.5.10 zz_Audit_InsertDateTime.sql
Name: $zz_Audit_InsertDateTime
Description: Gets the date and time of the insert event of the NodeId associated with the parameter in MM/DD/YYYY HH:MM:SS format
Syntax: $zz_Audit_InsertDateTime([<NodeId>])
Example:
- Using: $zz_Audit_InsertDateTime([DiagramId])
- Sample output: 03/12/2014 18:22:39
Notes:
- When no insert time is obtainable from the audit trail the output yields '
'.
4.5.11 zz_Audit_InsertDateTime2.sql
Name: $zz_Audit_InsertDateTime2
Description: Gets the date and time (no seconds) of the insert event of the NodeId associated with the parameter in DD.Month.YYYY :: HH:MM format
Syntax: $zz_Audit_InsertDateTime2([<NodeId>])
Example:
- Using: $zz_Audit_InsertDateTime2([DiagramId])
- Sample output: 12.March.2014 :: 18:22
Notes:
- When no insert time is obtainable from the audit trail the output yields '
'.
4.5.12 zz_Audit_LastUpdateDate.sql
Name: $zz_Audit_LastUpdateDate
Description: Gets the date of the latest update event of the NodeId associated with the parameter in MM/DD/YYYY format
Syntax: $zz_Audit_LastUpdateDate([<NodeId>])
Example:
- Using: $zz_Audit_LastUpdateDate([DiagramId])
- Sample output: 12/26/2014
Notes:
- When no update date is obtainable from the audit trail the output yields '
'. - See $zz_Audit_LastUpdateDate2 for a different date format.
4.5.13 zz_Audit_LastUpdateDate2.sql
Name: $zz_Audit_LastUpdateDate2
Description: Gets the date of the latest update event of the NodeId associated with the parameter in DD.Month.YYYY format
Syntax: $zz_Audit_LastUpdateDate2([<NodeId>])
Example:
- Using: $zz_Audit_LastUpdateDate2([DiagramId])
- Sample output: 21.March.2014
Notes:
- When no update date is obtainable from the audit trail the output yields '
'. - See $zz_Audit_LastUpdateDate for a different date format.
4.5.14 zz_Audit_LastUpdateDateTime.sql
Name: $zz_Audit_LastUpdateDateTime
Description: Gets the date and time of the update event of the NodeId associated with the parameter in MM/DD/YYYY HH:MM:SS format
Syntax: $zz_Audit_LastUpdateDateTime([<NodeId>])
Example:
- Using: $zz_Audit_LastUpdateDateTime([DiagramId])
- Sample output: 03/12/2014 18:22:39
Notes:
- When no update time is obtainable from the audit trail the output yields '
'. - Also see $zz_Audit_LastUpdateDateTime2 for an alternate date/time format
4.5.15 zz_Audit_LastUpdateDateTime2.sql
Name: $zz_Audit_LastUpdateDateTime2
Description: Gets the date and time of the update event of the NodeId associated with the parameter in DD.Month.YYYY :: HH:MM format
Syntax: $zz_Audit_LastUpdateDateTime2([<NodeId>])
Example:
- Using: $zz_Audit_LastUpdateDateTime2([DiagramId])
- Sample output: 12.March.2014 :: 18:22
Notes:
- When no update time is obtainable from the audit trail the output yields '
'. - Also see $zz_Audit_LastUpdateDateTime for an alternate date/time format
4.5.16 zz_Audit_TotalDeletes.sql
Name: $zz_Audit_TotalDeletes
Description: Retrieves the total delete actions in the audit trail.
Syntax: $zz_Audit_TotalDeletes()
Example:
- Using: $zz_Audit_TotalDeletes()
- Sample output: 55
Notes:
- Also review zz_Audit_TotalDeletesCurrentUser for user specific delete actions.
4.5.17 zz_Audit_TotalDeletesCurrentUser.sql
Name: $zz_Audit_TotalDeletesCurrentUser
Description: Retrieves the total delete actions in the audit trail by the given userId
Syntax: $zz_Audit_TotalDeletesCurrentUser([<userId>])
Example:
- Using: $zz_Audit_TotalDeletesCurrentUser('94000000000999')
- Sample output: 21
- Using: $zz_Audit_TotalDeletesCurrentUser([userId])
- Sample output: 26
Notes:
- Also review zz_Audit_TotalDeletes for global delete actions.
4.5.18 zz_Audit_TotalEntries.sql
Name: $zz_Audit_TotalEntries
Description: Retrieves the number of audit trail records.
Syntax: $zz_Audit_TotalEntries()
Example:
- Using: $zz_Audit_TotalEntries()
- Sample output: 5012
Notes:
- Also see $zz_Audit_TotalEntriesCurrentUser for user specific number of entries.
4.5.19 zz_Audit_TotalEntriesCurrentUser.sql
Name: $zz_Audit_TotalEntriesCurrentUser
Description: Retrieves the number of audit trail records.
Syntax: $zz_Audit_TotalEntriesCurrentUser([<userId>])
Example:
- Using: $zz_Audit_TotalEntriesCurrentUser([userId])
- Sample output: 684
Notes:
- Also see zz_Audit_TotalEntries for global number of entries.
4.5.20 zz_Audit_TotalInserts.sql
Name: $zz_Audit_TotalInserts
Description: Retrieves the number of audit trail insert records.
Syntax: $zz_Audit_TotalInserts()
Example:
- Using: $zz_Audit_TotalInserts()
- Sample output: 412
Notes:
- Also see $zz_Audit_TotalInsertsCurrentUser for user specific number of records.
4.5.21 zz_Audit_TotalInsertsCurrentUser.sql
Name: $zz_Audit_TotalInsertsCurrentUser
Description: Retrieves the number of audit trail insert records for the specified user id.
Syntax: $zz_Audit_TotalInsertsCurrentUser([<userId>])
Example:
- Using: $zz_Audit_TotalInsertsCurrentUser([userId])
- Sample output: 246
Notes:
- Also see zz_Audit_TotalInserts for global number of inserts.
4.5.22 zz_Audit_TotalUpdates.sql
Name: $zz_Audit_TotalUpdates
Description: Retrieves the number of audit trail update records.
Syntax: $zz_Audit_TotalUpdates()
Example:
- Using: $zz_Audit_TotalUpdates()
- Sample output: 4000
Notes:
- Also see $zz_Audit_TotalUpdatesCurrentUser for user specific number of update records.
4.5.23 zz_Audit_TotalUpdatesCurrentUser.sql
Name: $zz_Audit_TotalUpdatesCurrentUser
Description: Retrieves the number of audit trail update records by the specified user id.
Syntax: $zz_Audit_TotalUpdatesCurrentUser()
Example:
- Using: $zz_Audit_TotalUpdatesCurrentUser()
- Sample output: 549
Notes:
- Also see $zz_Audit_TotalUpdatesCurrentUser for global number of update records.
4.5.24 zz_Dash_Cards_OccupancyPerc.sql
Name: $zz_Dash_Cards_OccupancyPerc
Description: Returns the percentage of occupied card slots.
Syntax: $zz_Dash_Cards_OccupancyPerc()
Example:
- Using: $zz_Dash_Cards_OccupancyPerc()
- Sample output: 55.6
Notes:
- See zz_Dash_Cards_TotalCount for total number of cards.
- Expression is most useful with dashboard gauges.
4.5.25 zz_Dash_Cards_TotalCount.sql
Name: $zz_Dash_Cards_TotalCount
Description: Returns the number of card slots in existence.
Syntax: $zz_Dash_Cards_TotalCount()
Example:
- Using: $zz_Dash_Cards_TotalCount()
- Sample output: 5402
Notes:
- See zz_Dash_Cards_OccupancyPerc for percentage of occupied slots.
4.5.26 zz_Dash_Comments_TotalCount.sql
Name: $zz_Dash_Comments_TotalCount
Description: Returns the number of palette comment objects in existence.
Syntax: $zz_Dash_Comments_TotalCount()
Example:
- Using: $zz_Dash_Comments_TotalCount()
- Sample output: 368
Notes:
- Look for other dash expressions, which begin with zz_Dash_
4.5.27 zz_Dash_Devices_CardUtilization.sql
Name: $zz_Dash_Devices_CardUtilization
Description: Returns the percentage of device card utilization.
Syntax: $zz_Dash_Devices_CardUtilization()
Example:
- Using: $zz_Dash_Devices_CardUtilization()
- Sample output: 10
Notes:
- See zz_Dash_Cards_TotalCount for total number of cards.
- Expression is most useful with dashboard gauges.
4.5.28 zz_Dash_Devices_PortUtilization.sql
Name: $zz_Dash_Devices_PortUtilization
Description: Returns the percentage of all ports in use.
Syntax: $zz_Dash_Devices_PortUtilization()
Example:
- Using: $zz_Dash_Devices_PortUtilization()
- Sample output: 45
Notes:
- Expression is most useful with dashboard gauges.
4.5.29 zz_Dash_Devices_TotalCount.sql
Name: $zz_Dash_Devices_TotalCount
Description: Returns the total number of devices in netTerrain.
Syntax: $zz_Dash_Devices_TotalCount()
Example:
- Using: $zz_Dash_Devices_TotalCount()
- Sample output: 5047
Notes:
- There are other expressions for counting the number of devices by model, or status.
4.5.30 zz_Dash_Devices_TotalCountByModelId.sql
Name: $zz_Dash_Devices_TotalCountByModelId
Description: Returns the total number of devices in netTerrain with the specified type id.
Syntax: $zz_Dash_Devices_TotalCountByModelId(<Type_ID>)
Example:
- Using: $zz_Dash_Devices_TotalCountByModelId('26000000003634')
- Sample output: 300
Notes:
- You can retrieve the type ID of a device in the Catalog.
4.5.31 zz_Dash_Devices_TotalCountByStatusValue.sql
Name: $zz_Dash_Devices_TotalCountByStatusValue
Description: The expression will look at the field named "Status" and match the value with the specified parameter.
Syntax: $zz_Dash_Devices_TotalCountByStatusValue(<Status>)
Example:
- Using: $zz_Dash_Devices_TotalCountByStatusValue('Unknown')
- Sample output: 4
Notes:
- You may need to add a "Status" field to use this expression.
4.5.32 zz_Dash_Diagrams_1000_Nodes.sql
Name: $zz_Dash_Diagrams_1000_Nodes
Description: This expression will count the number of diagrams where there exist 1000 or more child nodes.
Syntax: $zz_Dash_Diagrams_1000_Nodes()
Example:
- Using: $zz_Dash_Diagrams_1000_Nodes()
- Sample output: 4
4.5.33 zz_Dash_Diagrams_100_To_249_Nodes.sql
Name: $zz_Dash_Diagrams_100_To_249_Nodes
Description: This expression will count the number of diagrams where there exist between 100-249 nodes.
Syntax: $zz_Dash_Diagrams_100_To_249_Nodes()
Example:
- Using: $zz_Dash_Diagrams_100_To_249_Nodes()
- Sample output: 4
4.5.34 zz_Dash_Diagrams_1_To_49_Nodes.sql
Name: $zz_Dash_Diagrams_1_To_49_Nodes
Description: This expression will count the number of diagrams where there exist between 1-49 nodes.
Syntax: $zz_Dash_Diagrams_1_To_49_Nodes()
Example:
- Using: $zz_Dash_Diagrams_1_To_49_Nodes()
- Sample output: 4
4.5.35 zz_Dash_Diagrams_250_To_499_Nodes.sql
Name: $zz_Dash_Diagrams_250_To_499_Nodes
Description: This expression will count the number of diagrams where there exist between 250-499 nodes.
Syntax: $zz_Dash_Diagrams_250_To_499_Nodes()
Example:
- Using: $zz_Dash_Diagrams_250_To_499_Nodes()
- Sample output: 4
4.5.36 zz_Dash_Diagrams_500_To_999_Nodes.sql
Name: $zz_Dash_Diagrams_500_To_999_Nodes
Description: This expression will count the number of diagrams where there exist between 500-999 nodes.
Syntax: $zz_Dash_Diagrams_500_To_999_Nodes()
Example:
- Using: $zz_Dash_Diagrams_500_To_999_Nodes()
- Sample output: 4
4.5.37 zz_Dash_Diagrams_50_To_99_Nodes.sql
Name: $zz_Dash_Diagrams_50_To_99_Nodes
Description: This expression will count the number of diagrams where there exist between 50-99 nodes.
Syntax: $zz_Dash_Diagrams_50_To_99_Nodes()
Example:
- Using: $zz_Dash_Diagrams_50_To_99_Nodes()
- Sample output: 4
4.5.38 zz_Dash_Diagrams_TotalCount.sql
Name: $zz_Dash_Diagrams_TotalCount
Description: This expression will count the number of unique diagrams.
Syntax: $zz_Dash_Diagrams_TotalCount()
Example:
- Using: $zz_Dash_Diagrams_TotalCount()
- Sample output: 4
4.5.39 zz_Dash_Documents_TotalCount.sql
Name: $zz_Dash_Documents_TotalCount
Description: Returns the number of palette document objects in existence.
Syntax: $zz_Dash_Documents_TotalCount()
Example:
- Using: $zz_Dash_Documents_TotalCount()
- Sample output: 96
Notes:
- Look for other dash expressions, which begin with zz_Dash_
4.5.40 zz_Dash_Links_TotalCount.sql
Name: $zz_Dash_Links_TotalCount
Description: Returns the number of link objects in netTerrain.
Syntax: $zz_Dash_Links_TotalCount()
Example:
- Using: $zz_Dash_Links_TotalCount()
- Sample Output: 96
4.5.41 zz_Dash_Nodes_TotalCount.sql
Name: $zz_Dash_Nodes_TotalCount
Description: Returns the number of Node objects in netTerrain.
Syntax: $zz_Dash_Nodes_TotalCount()
Example:
- Using: $zz_Dash_Nodes_TotalCount()
- Sample output: 53
4.5.42 zz_Dash_Palette_TotalCount.sql
Name: $zz_Dash_Palette_TotalCount
Description: Returns the number of palette objects in netTerrain.
Syntax: $zz_Dash_Palette_TotalCount()
Example:
- Using: $zz_Dash_Palette_TotalCount()
- Sample output: 96
Notes:
- There are also individual palette object counts for:
- documents, stamps, shapes, and comments.
4.5.43 zz_Dash_Ports_TotalCount.sql
Name: $zz_Dash_Ports_TotalCount
Description: Returns the number of port objects in netTerrain.
Syntax: $zz_Dash_Ports_TotalCount()
Example:
- Using: $zz_Dash_Ports_TotalCount()
- Sample output: 42033
4.5.44 zz_Dash_Racks_PowerInUsePerc.sql
Name: $zz_Dash_Racks_PowerInUsePerc
Description: Returns the power utilized on all racks with the mounted equipment.
Syntax: $zz_Dash_Racks_PowerInUsePerc()
Example:
- Using: $zz_Dash_Racks_PowerInUsePerc()
- Sample output: 37
Notes:
- Expression is most useful with dashboard gauges.
4.5.45 zz_Dash_Racks_PowerUsed.sql
Name: $zz_Dash_Racks_PowerUsed
Description: Returns the power used on all racks in Watt units.
Syntax: $zz_Dash_Racks_PowerUsed()
Example:
- Using: $zz_Dash_Racks_PowerUsed()
- Sample output: 37
Notes:
- All devices that should pertain to the power calculation must be mounted on racks.
4.5.46 zz_Dash_Racks_PowerUsedKW.sql
Name: $zz_Dash_Racks_PowerUsedKW
Description: Returns the power used on all racks in Kilowatt units.
Syntax: $zz_Dash_Racks_PowerUsedKW()
Example:
- Using: $zz_Dash_Racks_PowerUsedKW()
- Sample output: 37
Notes:
- All devices that should pertain to the power calculation must be mounted on racks.
4.5.47 zz_Dash_Racks_RUsInUsePerc.sql
Name: $zz_Dash_Racks_RUsInUsePerc
Description: Returns the percentage of rack units being utilized.
Syntax: $zz_Dash_Racks_RUsInUsePerc()
Example:
- Using: $zz_Dash_Racks_RUsInUsePerc()
- Sample output: 37
4.5.48 zz_Dash_Racks_RUsUsed.sql
Name: $zz_Dash_Racks_RUsUsed
Description: Returns the number of rack units utilized.
Syntax: $zz_Dash_Racks_RUsUsed()
Example:
- Using: $zz_Dash_Racks_RUsUsed()
- Sample output: 150
4.5.49 zz_Dash_Racks_TotalCount.sql
Name: $zz_Dash_Racks_TotalCount
Description: Returns the number of racks in existence.
Syntax: $zz_Dash_Racks_TotalCount()
Example:
- Using: $zz_Dash_Racks_TotalCount()
- Sample output: 180
4.5.50 zz_Dash_Racks_TotalPower.sql
Name: $zz_Dash_Racks_TotalPower
Description: Returns the total Watt power across all racks.
Syntax: $zz_Dash_Racks_TotalPower()
Example:
- Using: $zz_Dash_Racks_TotalPower()
- Sample output: 18032
4.5.51 zz_Dash_Racks_TotalPowerAvailable.sql
Name: $zz_Dash_Racks_TotalPowerAvailable
Description: Returns the Watts remaining for use.
Syntax: $zz_Dash_Racks_TotalPowerAvailable()
Example:
- Using: $zz_Dash_Racks_TotalPowerAvailable()
- Sample output: 18032
Notes:
- Also see zz_Dash_Racks_TotalPower, and zz_Dash_Racks_PowerUsed.
4.5.52 zz_Dash_Racks_TotalRUs.sql
Name: $zz_Dash_Racks_TotalRUs
Description: Returns the total rack units.
Syntax: $zz_Dash_Racks_TotalRUs()
Example:
- Using: $zz_Dash_Racks_TotalRUs()
- Sample output: 18032
4.5.53 zz_Dash_Racks_TotalWeight.sql
Name: $zz_Dash_Racks_TotalWeight
Description: Returns the total weight capacity of all racks in netTerrain.
Syntax: $zz_Dash_Racks_TotalWeight()
Example:
- Using: $zz_Dash_Racks_TotalWeight()
- Sample output: 448654
Notes:
- The weight is calculated using the 'Max Weight [lb]' field of rack objects.
4.5.54 zz_Dash_Racks_TotalWeightAvailable.sql
Name: $zz_Dash_Racks_TotalWeightAvailable
Description: Returns the total remaining weight capacity of all racks in netTerrain.
Syntax: $zz_Dash_Racks_TotalWeightAvailable()
Example:
- Using: $zz_Dash_Racks_TotalWeightAvailable()
- Sample output: 448654
Notes:
- The weight is calculated using the 'Max Weight [lb]' field of rack objects.
4.5.55 zz_Dash_Racks_WeightInUsePerc.sql
Name: $zz_Dash_Racks_WeightInUsePerc
Description: Returns the percentage of weight capacity used on all racks.
Syntax: $zz_Dash_Racks_WeightInUsePerc()
Example:
- Using: $zz_Dash_Racks_WeightInUsePerc()
- Sample output: 34
Notes:
- The weight is calculated using the 'Max Weight [lb]' and 'Weight used [lb]' fields of >rack objects.
4.5.56 zz_Dash_Racks_WeightUsed.sql
Name: $zz_Dash_Racks_WeightUsed
Description: Returns the total weight used across all racks.
Syntax: $zz_Dash_Racks_WeightUsed()
Example:
- Using: $zz_Dash_Racks_WeightUsed()
- Sample output: 34
Notes:
- The weight is calculated using the 'Weight used [lb]' field of rack objects.
4.5.57 zz_Dash_Racks_kBTUH.sql
Name: $zz_Dash_Racks_kBTUH
Description: Returns the power used across all racks in kilo British Thermal Unit Hours (kBTUH)
Syntax: $zz_Dash_Racks_kBTUH()
Example:
- Using: $zz_Dash_Racks_kBTUH()
- Sample output: 34
Notes:
- The power is calculated using the 'Power used [W]' field of racks.
4.5.58 zz_Dash_Shapes_TotalCount.sql
Name: $zz_Dash_Shapes_TotalCount
Description: Returns the number of palette shape objects in netTerrain.
Syntax: $zz_Dash_Shapes_TotalCount()
Example:
- Using: $zz_Dash_Shapes_TotalCount()
- Sample output: 96
Notes:
- Look for other dash expressions, which begin with zz_Dash_
4.5.59 zz_Dash_Slots_TotalCount.sql
Name: $zz_Dash_Slots_TotalCount
Description: Returns the number of slots unused.
Syntax: $zz_Dash_Slots_TotalCount()
Example:
- Using: $zz_Dash_Slots_TotalCount()
- Sample output: 34
Notes:
- A slot that has been filled with a card will be excluded from the count.
4.5.60 zz_Dash_Stamps_TotalCount.sql
Name: $zz_Dash_Stamps_TotalCount
Description: Returns the number of palette stamp objects in netTerrain.
Syntax: $zz_Dash_Stamps_TotalCount()
Example:
- Using: $zz_Dash_Stamps_TotalCount()
- Sample output: 96
Notes:
- Look for other palette dash expressions, which begin with zz_Dash_
4.5.61 zz_Dcm_PowerPerRackAvgKW.sql
Name: $zz_Dcm_PowerPerRackAvgKW
Description: Returns the power used on average across all mounted devices on the specified rack in Kilowatt units.
Syntax: $zz_Dcm_PowerPerRackAvgKW(<Rack_Id>)
Example:
- Using: $zz_Dcm_PowerPerRackAvgKW('24000000097829')
- Sample output: 2.36 kW
Notes:
- All devices that should pertain to the power calculation must be mounted on racks.
4.5.62 zz_Dcm_PowerPerRackDeratedKW.sql
Name: $zz_Dcm_PowerPerRackDeratedKW
Description: Returns the derated power used on specified rack in Kilowatt units.
Syntax: $zz_Dcm_PowerPerRackDeratedKW(<RackID>)
Example:
- Using: $zz_Dcm_PowerPerRackDeratedKW('24000000097829')
- Sample output: 5.7 kW
Notes:
- Must have the netTerrain Environmental Module or DCM software equivalent to use >expression.
4.5.63 zz_Dcm_PowerPerRackMaxDrawKW.sql
Name: $zz_Dcm_PowerPerRackMaxDrawKW
Description: Returns the power max draw on the specified rack in Kilowatt units.
Syntax: $zz_Dcm_PowerPerRackMaxDrawKW(<RackID>)
Example:
- Using: $zz_Dcm_PowerPerRackMaxDrawKW('24000000097829')
- Sample output: 7.69 kW
Notes:
- Must have the netTerrain Environmental Module or DCM software equivalent to use >expression.
- Uses value of 'MAX_POWER_DRAW' fields.
4.5.64 zz_Dcm_TemperatureInletPerRackAvgC.sql
Name: $zz_Dcm_TemperatureInletPerRackAvgC
Description: Returns the average temperature (Celsius) inlet of devices mounted on the specified rack.
Syntax: $zz_Dcm_TemperatureInletPerRackAvgC(<RackID>)
Example:
- Using: $zz_Dcm_TemperatureInletPerRackAvgC('24000000097829')
- Sample output: 7.69
Notes:
- Must have the netTerrain Environmental Module or DCM software equivalent to use >expression.
4.5.65 zz_Device_GetPortCountByPropertyValue.sql
Name: $zz_Device_GetPortCountByPropertyValue
Description: Returns the number of objects with the specified field name and value, which are located under the specified diagram.
Syntax: $zz_Device_GetPortCountByPropertyValue(<Diagram_ID>,<Field_Name>,<Field_Value>)
Example:
- Using: $zz_Device_GetPortCountByPropertyValue('24000000097829','Location', 'Maryland')
- Sample output: 55
4.5.66 zz_Device_Power_Derated.sql
Name: $zz_Device_Power_Derated
Description: Returns the derated power of the specified node id.
Syntax: $zz_Device_Power_Derated(<Node_ID>)
Example:
- Using: $zz_Device_Power_Derated('24000000097829')
- Sample output: 55
Notes:
- The expression uses the field 'Peak Power [W]' for values.
4.5.67 zz_Device_kBTUH.sql
Name: $zz_Device_kBTUH
Description: Returns the peak power in Kilo British Thermal Unit Hours (kBTUH).
Syntax: $zz_Device_kBTUH(<Node_ID>)
Example:
- Using: $zz_Device_kBTUH('24000000097829')
- Sample output: 2.39
Notes:
- The expression uses the field 'Peak Power [W]' for values.
4.5.68 zz_Diagram_GetDeviceCount.sql
Name: $zz_Diagram_GetDeviceCount
Description: Returns the number of devices on the specified diagram.
Syntax: $zz_Diagram_GetDeviceCount(<Diagram_ID>)
Example:
- Using: $zz_Diagram_GetDeviceCount('24000000097829')
- Sample output: 55
Notes:
- Count does not include devices on sub-diagrams.
4.5.69 zz_Diagram_GetPortCount.sql
Name: $zz_Diagram_GetPortCount
Description: Returns the number of ports on the specified diagram.
Syntax: $zz_Diagram_GetPortCount(<Diagram_ID>)
Example:
- Using: $zz_Diagram_GetPortCount('24000000097829')
- Sample output: 55
Notes:
- Count does not include ports on sub-diagrams.
4.5.70 zz_Diagram_GetPortCountByPropertyValue.sql
Name: $zz_Diagram_GetPortCountByPropertyValue
Description: Returns the number of ports by the specified diagram id, port field name and value. Every port of a device on the diagram meeting the specified values will be included in the count.
Syntax: $zz_Diagram_GetPortCountByPropertyValue(<Diagram_ID>, <Port_Field_Name>, <Port_Field_Value>)
Example:
- Using: $zz_Diagram_GetPortCountByPropertyValue('24000000097829', 'Description', >'Cisco STP successor path')
- Sample output: 8
Notes:
- Count does not include devices on sub-diagrams.
4.5.71 zz_ITK_AdaptersCount.sql
Name: $zz_ITK_AdaptersCount
Description: Returns the number of data source adapters.
Syntax: $zz_ITK_AdaptersCount()
Example:
- Using: $zz_ITK_AdaptersCount()
- Sample output: 8
4.5.72 zz_ITK_ConnectorsCount.sql
Name: $zz_ITK_ConnectorsCount
Description: Returns the number of built in data source connectors.
Syntax: $zz_ITK_ConnectorsCount()
Example:
- Using: $zz_ITK_ConnectorsCount()
- Sample output: 8
4.5.73 zz_ITK_DeviceConnectorCount.sql
Name: $zz_ITK_DeviceConnectorCount
Description: Returns the number of Device Connectors set-up in the netTerrain ITK.
Syntax: $zz_ITK_DeviceConnectorCount()
Example:
- Using: $zz_ITK_DeviceConnectorCount()
- Sample output: 2
4.5.74 zz_ITK_LinkersCount.sql
Name: $zz_ITK_LinkersCount
Description: Returns the number of linker sources.
Syntax: $zz_ITK_LinkersCount()
Example:
- Using: $zz_ITK_LinkersCount()
- Sample output: 77
4.5.75 zz_ITK_Mon_Databases_Count_Active.sql
Name: $zz_ITK_Mon_Databases_Count_Active
Description: Returns the database count with active status.
Syntax: $zz_ITK_Mon_Databases_Count_Active()
Example:
- Using: $zz_ITK_Mon_Databases_Count_Active()
- Sample output: 77
4.5.76 zz_ITK_Mon_Databases_Count_Inactive.sql
Name: $zz_ITK_Mon_Databases_Count_Inactive
Description: Returns the database count with inactive status.
Syntax: $zz_ITK_Mon_Databases_Count_Inactive()
Example:
- Using: $zz_ITK_Mon_Databases_Count_Inactive()
- Sample output: 55
4.5.77 zz_ITK_Mon_Databases_Count_Unknown.sql
Name: $zz_ITK_Mon_Databases_Count_Unknown
Description: Returns the database count with unknown status.
Syntax: $zz_ITK_Mon_Databases_Count_Unknown()
Example:
- Using: $zz_ITK_Mon_Databases_Count_Unknown()
- Sample output: 66
4.5.78 zz_ITK_Mon_Databases_DataFileSize_Active.sql
Name: $zz_ITK_Mon_Databases_DataFileSize_Active
Description: Returns the data file size with active status.
Syntax: $zz_ITK_Mon_Databases_DataFileSize_Active()
Example:
- Using: $zz_ITK_Mon_Databases_DataFileSize_Active()
- Sample output: 297.479
4.5.79 zz_ITK_Mon_Databases_DataFileSize_Inactive.sql
Name: $zz_ITK_Mon_Databases_DataFileSize_Inactive
Description: Returns the data file size with inactive status.
Syntax: $zz_ITK_Mon_Databases_DataFileSize_Inactive()
Example:
- Using: $zz_ITK_Mon_Databases_DataFileSize_Inactive()
- Sample output: 297.479
4.5.80 zz_ITK_Mon_Databases_DataFileSize_Unknown.sql
Name: $zz_ITK_Mon_Databases_DataFileSize_Unknown
Description: Returns the data file size with unknown status.
Syntax: $zz_ITK_Mon_Databases_DataFileSize_Unknown()
Example:
- Using: $zz_ITK_Mon_Databases_DataFileSize_Unknown()
- Sample output: 297.479
4.5.81 zz_ITK_Mon_Databases_LogFileSize_Active.sql
Name: $zz_ITK_Mon_Databases_LogFileSize_Active
Description: Returns the log file size of logs with active status.
Syntax: $zz_ITK_Mon_Databases_LogFileSize_Active()
Example:
- Using: $zz_ITK_Mon_Databases_LogFileSize_Active()
- Sample output: 297.479
4.5.82 zz_ITK_Mon_Databases_LogFileSize_Inactive.sql
Name: $zz_ITK_Mon_Databases_LogFileSize_Inactive
Description: Returns the log file size of logs with inactive status.
Syntax: $zz_ITK_Mon_Databases_LogFileSize_Inactive()
Example:
- Using: $zz_ITK_Mon_Databases_LogFileSize_Inactive()
- Sample output: 297.479
4.5.83 zz_ITK_Mon_Databases_LogFileSize_Unknown.sql
Name: $zz_ITK_Mon_Databases_LogFileSize_Unknown
Description: Returns the log file size of logs with unknown status.
Syntax: $zz_ITK_Mon_Databases_LogFileSize_Unknown()
Example:
- Using: $zz_ITK_Mon_Databases_LogFileSize_Unknown()
- Sample output: 297.479
4.5.84 zz_Link_GetCountByPropertyAndValue_ExactMatch.sql
Name: $zz_Link_GetCountByTypeAndPropertyAndValue_ExactMatch
Description: The expression will return the count of links that match the specified link field name and field value.
Syntax: $zz_Link_GetCountByTypeAndPropertyAndValue_ExactMatch(<Exact_Field_Name>, <Exact_Field_Value>)
Example:
- Using: $zz_Link_GetCountByTypeAndPropertyAndValue_ExactMatch('Status', 'Online')
Sample output: 20
Using: $zz_Link_GetCountByTypeAndPropertyAndValue_ExactMatch('Name', 'New')
Sample output: 5
Using: $zz_Link_GetCountByTypeAndPropertyAndValue_ExactMatch('Location', 'MD')
- Sample output: 2
Notes:
- Notice you must specify the exact field name, and field value.
- See zz_Link_GetCountByPropertyAndValue_PartialMatch for partial value matching.
4.5.85 zz_Link_GetCountByPropertyAndValue_PartialMatch.sql
Name: $zz_Link_GetCountByPropertyAndValue_PartialMatch
Description: The expression will return the count of links that match the specified link field name and field value.
Syntax: $zz_Link_GetCountByPropertyAndValue_PartialMatch(<Exact_Field_Name>, <Partial_Field_Value>)
Example:
- Using: $zz_Link_GetCountByPropertyAndValue_PartialMatch('Status', 'Plan')
Sample output: 20
Using: $zz_Link_GetCountByPropertyAndValue_PartialMatch('Name', 'N')
Sample output: 5
Using: $zz_Link_GetCountByPropertyAndValue_PartialMatch('Location', 'Mary')
- Sample output: 2
Notes:
- Notice you must specify the exact field name, but partial field value.
- See zz_Link_GetCountByPropertyAndValue_ExactMatch for exact value matching.
4.5.86 zz_Link_GetCountByTypeAndPropertyAndValue_ExactMatch.sql
Name: $zz_Link_GetCountByTypeAndPropertyAndValue_ExactMatch
Description: The expression will return the count of links that match the specified link type, field name, and field value.
Syntax: $zz_Link_GetCountByTypeAndPropertyAndValue_ExactMatch(<Exact_Type_Value>, <Exact_Field_Name>, <Exact_Field_Value>)
Example:
- Using: $zz_Link_GetCountByTypeAndPropertyAndValue_ExactMatch('Ethernet', 'Status', >'Online')
Sample output: 20
Using: $zz_Link_GetCountByTypeAndPropertyAndValue_ExactMatch('FastEthernet', 'Name', 'New')
Sample output: 5
Using: $zz_Link_GetCountByTypeAndPropertyAndValue_ExactMatch('FastEthernet', 'Location', 'MD')
- Sample output: 2
Notes:
- Notice you must specify the exact type, field name, and field value.
- See zz_Link_GetCountByTypeAndPropertyAndValue_PartialMatch for partial value matching.
4.5.87 zz_Link_GetCountByTypeAndPropertyAndValue_PartialMatch.sql
Name: $zz_Link_GetCountByTypeAndPropertyAndValue_PartialMatch
Description: The expression will return the count of links that match the specified link type, field name, and partial field value.
Syntax: $zz_Link_GetCountByTypeAndPropertyAndValue_PartialMatch(<Exact_Type_Value>, <Exact_Field_Name>, <Partial_Field_Value>)
Example:
- Using: $zz_Link_GetCountByTypeAndPropertyAndValue_ExactMatch('Ethernet', 'Status', >'On')
Sample output: 20
Using: $zz_Link_GetCountByTypeAndPropertyAndValue_ExactMatch('FastEthernet', 'Name', 'N')
Sample output: 5
Using: $zz_Link_GetCountByTypeAndPropertyAndValue_ExactMatch('FastEthernet', 'Location', 'Mary')
- Sample output: 2
Notes:
- Notice you must specify the exact type, field name, and partial field value.
- See zz_Link_GetCountByTypeAndPropertyAndValue_ExactMatch for exact value matching.
4.5.88 zz_Link_GetCountByTypeAndValue_ExactMatch.sql
Name: $zz_Link_GetCountByTypeAndValue_ExactMatch
Description: The expression will return the count of links that match the specified link type and field value.
Syntax: $zz_Link_GetCountByTypeAndValue_ExactMatch(<Exact_Type_Value>, <Exact_Field_Value>)
Example:
- Using: $zz_Link_GetCountByTypeAndValue_ExactMatch('Ethernet', 'Online')
Sample output: 20
Using: $zz_Link_GetCountByTypeAndValue_ExactMatch('FastEthernet', 'Offline')
Sample output: 5
Using: $zz_Link_GetCountByTypeAndValue_ExactMatch('FastEthern', 'On')
- Sample output: 0
Notes:
- Notice you must specify the exact type and field value
- See zz_Link_GetCountByTypeAndValue_PartialMatch for partial value matching.
4.5.89 zz_Link_GetCountByTypeAndValue_PartialMatch.sql
Name: $zz_Link_GetCountByTypeAndValue_PartialMatch
Description: The expression will return the count of links that match the specified link type and field value. The field value must match at least what was specified in the parameter.
Syntax: $zz_Link_GetCountByTypeAndValue_PartialMatch(<Exact_Type_Value>, <Partial_Field_Value>)
Example:
- Using: $zz_Link_GetCountByTypeAndValue_PartialMatch('Ethernet', 'O')
Sample output: 20
Using: $zz_Link_GetCountByTypeAndValue_PartialMatch('FastEthernet', 'Offlin')
Sample output: 4
Using: $zz_Link_GetCountByTypeAndValue_PartialMatch('FastEthern', 'O')
- Sample output: 5
Notes:
- Notice you do not have to specify the exact field value.
- See zz_Link_GetCountByTypeAndValue_ExactMatch for exact value matching.
4.5.90 zz_Link_GetCountByType_ExactMatch.sql
Name: $zz_Link_GetCountByType_ExactMatch
Description: The expression will return the count of links that match the specified link type value.
Syntax: $zz_Link_GetCountByType_ExactMatch(<Partial_Type_Value>)
Example:
- Using: $zz_Link_GetCountByType_ExactMatch('Ethernet')
Sample output: 22
Using: $zz_Link_GetCountByType_ExactMatch('FastEthernet')
Sample output: 55
Using: $zz_Link_GetCountByType_ExactMatch('FastEthern')
- Sample output: 0
Notes:
- Notice you must specify the exact type value.
- See zz_Link_GetCountByType_PartialMatch for partial type matches.
4.5.91 zz_Link_GetCountByType_PartialMatch.sql
Name: $zz_Link_GetCountByType_PartialMatch
Description: The expression will return the count of links that match the specified link type value. The type value must match at least what was specified in the parameter.
Syntax: $zz_Link_GetCountByType_PartialMatch(<Partial_Type_Value>)
Example:
- Using: $zz_Link_GetCountByType_PartialMatch('Ether')
Sample output: 22
Using: $zz_Link_GetCountByType_PartialMatch('FastEther')
- Sample output: 55
Notes:
- Notice you do not have to specify the exact type value.
- See zz_Link_GetCountByType_ExactMatch for exact type matches.
4.5.92 zz_Link_GetCountByValue_ExactMatch.sql
Name: $zz_Link_GetCountByValue_ExactMatch
Description: The expression will return the count of links that match the specified field value. The value specified must match exactly.
Syntax: $zz_Link_GetCountByValue_ExactMatch(<Partial_Field_Value>)
Example:
- Using: $zz_Link_GetCountByValue_ExactMatch('Name')
Sample output: 22
Using: $zz_Link_GetCountByValue_ExactMatch('Carrier ID')
- Sample output: 55
Notes:
- Notice you must specify the exact field value.
- See zz_Link_GetCountByValue_PartialMatch for partial matches.
4.5.93 zz_Link_GetCountByValue_PartialMatch.sql
Name: $zz_Link_GetCountByValue_PartialMatch
Description: The expression will return the count of links by the specified link property value. The value must match at least what was specified in the parameter. This value can be contained in any field that pertains to a link object.
Syntax: $zz_Link_GetCountByValue_PartialMatch(<Partial_Field_Value>)
Example:
- Using: $zz_Link_GetCountByValue_PartialMatch('Nam')
Sample output: 22
Using: $zz_Link_GetCountByValue_PartialMatch('Name')
Sample output: 22
Using: $zz_Link_GetCountByValue_PartialMatch('Carrier I')
Sample output: 55
Using: $zz_Link_GetCountByValue_PartialMatch('Carrier ID')
- Sample output: 55
Notes:
- Notice you do not have to specify the exact field value.
- See zz_Link_GetCountByValue_ExactMatch for exact matches.
4.5.94 zz_Link_LinkEndingPoint.sql
Name: $zz_Link_LinkEndingPoint
Description: The expression will return the ending object's name of the link.
Syntax: $zz_Link_LinkEndingPoint(<Link_ID>)
Example:
- Using: $zz_Link_LinkEndingPoint('25000000021612')
Sample output: Port 20
Using: $zz_Link_LinkStartingPoint('25000000021613')
- Sample output: Node Lvl 22
Notes:
- Please see zz_Link_LinkStartingPoint to retrieve the other link end object's name.
4.5.95 zz_Link_LinkEndingPortConnector.sql
Name: $zz_Link_LinkEndingPortConnector
Description: The expression will return the connector value of the ending port.
Syntax: $zz_Link_LinkEndingPortConnector(<Link_ID>)
Example:
- Using: $zz_Link_LinkEndingPortConnector('25000000021612')
- Sample output: Outlet
Notes:
- Please see zz_Link_LinkStartingPortConnector to retrieve the other port Connector.
4.5.96 zz_Link_LinkEndingPortProtocol.sql
Name: $zz_Link_LinkEndingPortProtocol
Description: The expression will return the protocol value of the starting port.
Syntax: $zz_Link_LinkEndingPortProtocol(<Link_ID>)
Example:
- Using: $zz_Link_LinkEndingPortProtocol('25000000021612')
- Sample output: Outlet
Notes:
- Please see zz_Link_LinkStartingPortProtocol to retrieve the other port protocol.
4.5.97 zz_Link_LinkEndingPortStatus.sql
Name: $zz_Link_LinkEndingPortStatus
Description: The expression will return the status value of the ending port.
Syntax: $zz_Link_LinkEndingPortStatus(<Link_ID>)
Example:
- Using: $zz_Link_LinkEndingPortStatus('25000000021612')
- Sample output: Planned
Notes:
- Please see zz_Link_LinkStartingPortStatus to retrieve the other port status.
4.5.98 zz_Link_LinkName .sql
Name: $zz_Link_LinkName
Description: The expression will return the field name value of the specified link id.
Syntax: $zz_Link_LinkName (<Link_ID>)
Example:
- Using: $zz_Link_LinkName ('25000000021612')
- Sample output: Link from Chicago to MD LOC 33
4.5.99 zz_Link_LinkStartingPoint.sql
Name: $zz_Link_LinkStartingPoint
Description: The expression will return the ending object's name of the link.
Syntax: $zz_Link_LinkStartingPoint(<Link_ID>)
Example:
- Using: $zz_Link_LinkStartingPoint('25000000021612')
Sample output: Port 1
Using: $zz_Link_LinkStartingPoint('25000000021613')
- Sample output: Node Lvl 55
Notes:
- Please see zz_Link_LinkEndingPoint to retrieve the other link end object's name.
4.5.100 zz_Link_LinkStartingPortConnector.sql
Name: $zz_Link_LinkStartingPortConnector
Description: The expression will return the connector value of the starting port.
Syntax: $zz_Link_LinkStartingPortConnector(<Link_ID>)
Example:
- Using: $zz_Link_LinkStartingPortConnector('25000000021612')
- Sample output: Outlet
Notes:
- Please see zz_Link_LinkStartingPortProtocol to retrieve the other port protocol.
4.5.101 zz_Link_LinkStartingPortProtocol.sql
Name: $zz_Link_LinkStartingPortProtocol
Description: The expression will return the protocol value of the starting port.
Syntax: $zz_Link_LinkStartingPortProtocol(<Link_ID>)
Example:
- Using: $zz_Link_LinkStartingPortProtocol('25000000021612')
- Sample output: Power
Notes:
- Please see zz_Link_LinkEndingPortProtocol to retrieve the other port protocol.
4.5.102 zz_Link_LinkStartingPortStatus.sql
Name: $zz_Link_LinkStartingPortStatus
Description: The expression will return the status value of the starting port.
Syntax: $zz_Link_LinkStartingPortStatus(<Link_ID>)
Example:
- Using: $zz_Link_LinkStartingPortStatus('25000000021612')
- Sample output: Planned
Notes:
- Please see zz_Link_LinkEndingPortStatus to retrieve the other port status.
4.5.103 zz_Link_Name .sql
Name: $zz_Link_Name
Description: The expression will return the field name value of the specified link id.
Syntax: $zz_Link_Name(<Link_ID>)
Example:
- Using: $zz_Link_Name('25000000021612')
- Sample output: MD to VA Link
4.5.104 zz_Link_ValueByPropertyName.sql
Name: $zz_Link_ValueByPropertyName
Description: The expression will return the field value corresponding to the specified link and field name.
Syntax: $zz_Link_ValueByPropertyName(<Link_ID>, <Field_Name>)
Example:
- Using: $zz_Link_ValueByPropertyName('25000000021612', 'Name')
- Sample output: New Link
4.5.105 zz_Misc_Date.sql
Name: $zz_Misc_Date
Description: The expression will return the system's current date and time in the following format mm/dd/yyyy. For another format see $zz_Misc_Date2
Syntax: $zz_Misc_Date()
Example:
- Using: $zz_Misc_Date()
- Sample output: 2015-01-09 16:04:26.540
Notes:
- The expression can be useful when exporting diagrams and noting the time it was exported.
4.5.106 zz_Node_CountChildren.sql
Name: $zz_Node_CountChildren
Description: The expression will return the count of objects in the child diagram of the specified node.
Syntax: $zz_Node_CountChildren(<Node_ID>)
Example:
- Using: $zz_Node_CountChildren('24000000031910')
- Sample output: 20
4.5.107 zz_Node_CountChildrenFullSubtree.sql
Name: $zz_Node_CountChildrenFullSubtree
Description: The expression will return the count of all descendants of the specified node.
Syntax: $zz_Node_CountChildrenFullSubtree(<Node_ID>)
Example:
- Using: $zz_Node_CountChildrenFullSubtree('24000000031910')
Sample output: 20
Using: $zz_Node_CountChildrenFullSubtree([id])
- Sample output: 20
4.5.108 zz_Node_CountDocuments.sql
Name: $zz_Node_CountDocuments
Description: Returns the number of documents attached to the node.
Syntax: $zz_Node_CountDocuments(<Node_ID>)
Example:
- Using: $zz_Node_CountDocuments('24000000031897')
- 5
4.5.109 zz_Node_CountLinksConnected.sql
Name: $zz_Node_CountLinksConnected
Description: The expression will return the count of links to the specified node.
Syntax: $zz_Node_CountLinksConnected(<Node_ID>)
Example:
- Using: $zz_Node_CountLinksConnected('24000000031910')
- Sample output: 5
4.5.110 zz_Node_GetAncestorFieldValue.sql
Name: $zz_Node_GetAncestorFieldValue
Description: The expression will return the count of objects with the specified property field name and partial field property value.
Syntax: $zz_Node_GetAncestorFieldValue(<Exact_Type_Name>, <Exact_Field_Name>, <Object_ID>)
Example:
- Using: $zz_Node_GetAncestorFieldValue('42U Rack D','Name', '24000000031910')
- Note: Assume the id number is the id of a mounted device on the specified type name.
Sample output: Rack Name
Using: $zz_Node_GetAncestorFieldValue('Node','Name', '24000000032649')
- Note: This outputs the object's parent name.
- Sample output: Working Area Node
4.5.111 zz_Node_GetCountByPropertyAndValue_ExactMatch.sql
Name: $zz_Node_GetCountByPropertyAndValue_ExactMatch
Description: The expression will return the count of objects with the specified property field name and exact field property value.
Syntax: $zz_Node_GetCountByPropertyAndValue_ExactMatch(<Exact_Field_Name>, <Exact_Field_Value>)
Example:
- Using: $zz_Node_GetCountByPropertyAndValue_ExactMatch('Location', 'Maryland')
- Sample output: 255
4.5.112 zz_Node_GetCountByPropertyAndValue_PartialMatch.sql
Name: $zz_Node_GetCountByPropertyAndValue_PartialMatch
Description: The expression will return the count of objects with the specified property field name and partial field property value.
Syntax: $zz_Node_GetCountByPropertyAndValue_PartialMatch(<Exact_Field_Name>, <Partial_Field_Value>)
Example:
- Using: $zz_Node_GetCountByPropertyAndValue_PartialMatch('Location', 'Maryl')
- Sample output: 255
4.5.113 zz_Node_GetCountByTypeAndPropertyAndValue_ExactMatch.sql
Name: $zz_Node_GetCountByTypeAndPropertyAndValue_ExactMatch
Description: The expression will return the count of objects with the specified type, exact property field name and exact field property value.
Syntax: $zz_Node_GetCountByTypeAndPropertyAndValue_ExactMatch(<Exact_Type_Value>, <Exact_Field_Name>, <Exact_Field_Value>)
Example:
- Using: $zz_Node_GetCountByTypeAndPropertyAndValue_ExactMatch('Cisco 2960','Location', >'MD')
- Sample output: 5
4.5.114 zz_Node_GetCountByTypeAndPropertyAndValue_PartialMatch.sql
Name: $zz_Node_GetCountByTypeAndPropertyAndValue_PartialMatch
Description: The expression will return the count of objects with the specified type, exact property field name and partial field property value.
Syntax: $zz_Node_GetCountByTypeAndPropertyAndValue_PartialMatch(<Exact_Type_Value>, <Exact_Field_Name>, <Partial_Field_Value>)
Example:
- Using: $zz_Node_GetCountByTypeAndPropertyAndValue_PartialMatch('Cisco 2960','Location', 'MD')
- Sample output: 5
4.5.115 zz_Node_GetCountByTypeAndValue_ExactMatch.sql
Name: $zz_Node_GetCountByTypeAndValue_ExactMatch
Description: The expression will return the count of objects with the specified type and exact field property value.
Syntax: $zz_Node_GetCountByTypeAndValue_ExactMatch(<Exact_Type_Value>, <Exact_Field_Value>)
Example:
- Using: $zz_Node_GetCountByTypeAndValue_ExactMatch('Cisco 2960','7')
- Sample output: 5
4.5.116 zz_Node_GetCountByTypeAndValue_PartialMatch.sql
Name: $zz_Node_GetCountByTypeAndValue_PartialMatch
Description: The expression will return the count of objects with the specified type and partial field value match.
Syntax: $zz_Node_GetCountByTypeAndValue_PartialMatch(<Exact_Type_Value>, <Partial_Field_Value>)
Example:
- Using: $zz_Node_GetCountByTypeAndValue_PartialMatch('Cisco 2960', 'Maryla')
- Sample output: 5
4.5.117 zz_Node_GetCountByType_ExactMatch.sql
Name: $zz_Node_GetCountByType_ExactMatch
Description: The expression will return the count of objects with the specified type.
Syntax: $zz_Node_GetCountByType_ExactMatch(<Exact_Field_Value>)
Example:
- Using: $zz_Node_GetCountByType_ExactMatch('Cisco 29')
Sample output: 0
Using: $zz_Node_GetCountByType_ExactMatch('Cisco 2960')
- Sample output: 5
4.5.118 zz_Node_GetCountByType_ExactMatch_WithSearchUrl.sql
Name: $zz_Node_GetCountByType_ExactMatch_WithSearchUrl
Description: The expression will return the count as a click-able object, which opens a new window of all the matched instances. The other window is an information table including the matched objects': project location, name, type, and property value id.
Syntax: $zz_Node_GetCountByType_ExactMatch_WithSearchUrl(<Exact_Type_Value>)
Example:
- Using: $zz_Node_GetCountByType_ExactMatch_WithSearchUrl('Cisco 123456')
- Sample output: [2]
4.5.119 zz_Node_GetCountByType_PartialMatch.sql
Name: $zz_Node_GetCountByType_PartialMatch
Description: The expression will return the count of objects with the specified type. The specified param portion must exist in the type name. See the example usage
Syntax: $zz_Node_GetCountByType_PartialMatch(<Partial_Field_Value>)
Example:
- Using: $zz_Node_GetCountByType_PartialMatch('Cisco 29')
Sample output: 50
Using: $zz_Node_GetCountByType_PartialMatch('Cisco 2960')
- Sample output: 1
4.5.120 zz_Node_GetCountByValue_ExactMatch.sql
Name: $zz_Node_GetCountByValue_ExactMatch
Description: The expression will return the count of objects which contain exactly the specified value.
Syntax: $zz_Node_GetCountByValue_ExactMatch(<Exact_Field_Value>)
Example:
- Using: $zz_Node_GetCountByValue_ExactMatch('Maryland Office 55 Room 1')
Sample output: 0
Using: $zz_Node_GetCountByValue_ExactMatch('Maryland Office 55 Room 101')
- Sample output: 1
4.5.121 zz_Node_GetCountByValue_PartialMatch.sql
Name: $zz_Node_GetCountByValue_PartialMatch
Description: The expression will return the count of objects which contain the at least the specified value and possibly more.
Syntax: $zz_Node_GetCountByValue_PartialMatch(<Partial_Field_Value>)
Example:
- Using: $zz_Node_GetCountByValue_PartialMatch('Maryland Office 55 Room 1')
Sample output: 5
Using: $zz_Node_GetCountByValue_PartialMatch('Maryland Office 55 Room 101')
- Sample output: 1
Notes:
- The above would work for all fields that contain the value Maryland Office 55 Room 1xxxx
4.5.122 zz_Node_GetValueByPropertyName.sql
Name: $zz_Node_GetValueByPropertyName
Description: The expression will return child object's property field value based on the specified object id and field name.
Syntax: $zz_Node_GetValueByPropertyName(<Node_ID>, <Field_Name>)
Example:
- Using: $zz_Node_GetValueByPropertyName('24000000031899', 'Name')
Sample output: Rack 101
Using: $zz_Node_GetValueByPropertyName('24000000031899', 'Power [W]')
- Sample output: 250
4.5.123 zz_Node_IP_addresses_Children.sql
Name: $zz_Node_IP_addresses_Children
Description: The expression will return child object's property field ip addresses.
Syntax: $zz_Node_IP_addresses_Children(<Node_ID>)
Example:
- Using: $zz_Node_IP_addresses_Children('24000000031897')
- Sample output: 192.168.1.66
4.5.124 zz_Node_MultiValuesByFieldNameInOneField.sql
Name: $zz_Node_MultiValuesByFieldNameInOneField
Description: Returns the field values of the specified node id and field name. Any node (cards included) under the node id will be included in the return.
Syntax: $zz_Node_MultiValuesByFieldNameInOneField(<Node_ID>, <Field_Name>)
Example:
- Using: $zz_Node_MultiValuesByFieldNameInOneField('24000000031897', 'Description')
- Sample output: Cisco Device 1; Card slot 1; Node Parent
4.5.125 zz_Node_Name.sql
Name: $zz_Node_Name
Description: Returns the name of the specified id.
Syntax: $zz_Node_Name(<Node_ID>)
Example:
- Using: $zz_Node_Name('24000000031897')
- Sample output: New Node
4.5.126 zz_Node_ParentName.sql
Name: $zz_Node_ParentName
Description: The expression will return the node's parent's object name.
Syntax: $zz_Node_ParentName(<Node_ID>)
Example:
- Using: $zz_Node_ParentName('24000000031897')
- Sample output: Work area lv5
4.5.127 zz_Node_RackPosition.sql
Name: $zz_Node_RackPosition
Description: The expression will return the object's mounted rack unit location number.
Syntax: $zz_Node_RackPosition(<Device_ID>)
Example:
- Using: $zz_Node_RackPosition('24000000031897')
- Sample output: 9
4.5.128 zz_Node_Type.sql
Name: $zz_Node_Type
Description: The expression will return the object's type name based on the specified id.
Syntax: $zz_Node_Type([UserId])
Example:
- Using: $zz_Node_Type([DiagramId])
Sample output: Node
Using: $zz_Node_Type([id])
Sample output: Cisco 3945
Using: $zz_Node_Type('24000000031897')
- Sample output: Cisco 3945
Notes:
- This expression can be used with ease when specifying the id with the reserved params.
4.5.129 zz_Node_getCheckedFieldNames.sql
Name: $zz_Node_getCheckedFieldNames
Description: Returns the field names of the specified node id. The second parameter will exclude the specified field name.
Syntax: $zz_Node_getCheckedFieldNames(<Node_ID>, <Exclusion_List>)
Example:
- Using: $zz_Node_getCheckedFieldNames('24000000031897','')
- Sample output:
- Name:
- Peak Power [W]:
- Weight [lb]:
Field Names:
Using: $zz_Node_getCheckedFieldNames('24000000031897','Field Names')
- Sample output:
- Name:
- Peak Power [W]:
- Weight [lb]:
Notes:
- This is handy for making diagrams that show the field name and the value beside it.
- To display the value and name, you simply check the desired field and drag the value beside the field name.
4.5.130 zz_Object_Id.sql
Name: $zz_Object_Id
Description: Returns the id of the object using the expression.
Syntax: $zz_Object_Id([id])
Example:
- Using: $zz_Object_Id([id])
Sample output: 24000000031897
Using: $zz_Object_Id([DiagramId])
- Sample output: 24000000031863
4.5.131 zz_Port_DeviceParentName.sql
Name: $zz_Port_DeviceParentName
Description: Returns the name of the port's parent object:
Syntax: $zz_Port_DeviceParentName(<Port_ID>)
Example:
- Using: $zz_Port_DeviceParentName('23000000040569')
- Sample output: Cisco Device
4.5.132 zz_Port_RackDevicePortPath.sql
Name: $zz_Port_RackDevicePortPath
Description: Returns the path of the port in the following format: '
Syntax: $zz_Port_RackDevicePortPath(<Port_ID>)
Example:
- Using: $zz_Port_RackDevicePortPath('23000000040569')
- Sample output: Rack::Cisco Device::2
4.5.133 zz_Ports_UsedPortsOnDevice.sql
Name: $zz_Ports_UsedPortsOnDevice
Description: Returns the number of used ports on a specified device.
Syntax: $zz_Ports_UsedPortsOnDevice(<Device_ID>)
Example:
- Using: $zz_Ports_UsedPortsOnDevice('24000000031897')
- Sample output: 5
4.5.134 zz_Project_GenericNodeCount.sql
Name: $zz_Project_GenericNodeCount
Description: Returns the netTerrain project number of Nodes.
Syntax: $zz_Project_GenericNodeCount()
Example:
- Using: $zz_Project_GenericNodeCount()
- Sample output: 20002
5 Dashboard Designer Guide
Every netTerrain server installation comes with a Dashboard Designer (or Editor), a full-fledged business intelligence tool at your disposal, perfectly suited for creating all sorts of dashboards for data visualization, aggregation and presentation. This editor provides a comprehensive UI for designing dashboards from scratch.
The netTerrain Dashboard Editor is typically accessible from the programs menu in your netTerrain server installation:
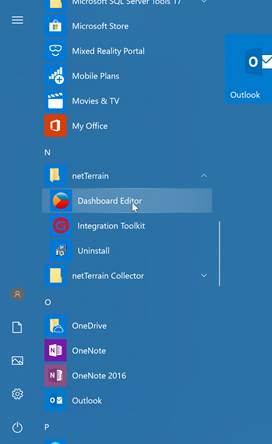
Dashboard designer access
Since the dashboard designer is a thick client residing on the netTerrain server, read or write permission is usually only granted for administrators that have access to the server. The designer itself does not include a login mechanism since, as mentioned before, it resides on the server already.
Some of the capabilities of the dashboard designer include:
- Supported for a wide array of data providers.
- Dashboard items used to visualize data on the dashboard in various ways
- Filtering elements
- Interactivity features to apply filtering to a dashboard or analyze data at different detail levels
- Data shaping features to use various data shaping operations such as grouping, sorting, filtering, formatting, etc.
- Printing and exporting capabilities
5.1 Dashboard designer basics
The Dashboard Designer provides an intuitive UI that facilitates data binding and shaping, and layout design.
Many of these normally complex tasks can be accomplished with a simple drag-and-drop operation, allowing you to start creating dashboards immediately. Once a dashboard has been designed, it is saved as an xml and automatically pushed to the netTerrain server so that end users can view it from their web browser.
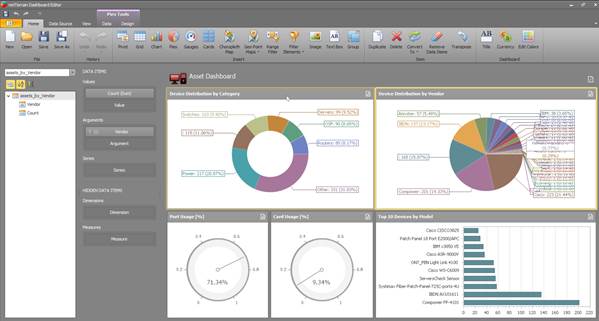
Main dashboard designer view
The main process for creating a dashboard typically involves the following activities:
- Creating a Data Source
- Designing a dashboard layout
- Binding data to the dashboard widgets
- Data shaping and interactivity
- Coloring and other aesthetical design activities
- Saving
5.1.1 Common dashboard widgets
The Dashboard Viewer is used to present dashboards in Windows Forms applications. A wide range of dashboard items (or widgets) are used to display visual or textual information.

Common dashboard widgets
The Dashboard designer also has the capability of including images and text in dashboard, which will be reviewed later.
5.1.2 User Interface
The Dashbaord designer UI consists of a thick client windows application with drag-and-drop functionality to speed up the process of designing dashboards. It also includes a variety of themes (which we will switch up throughout this guide), so that you can adjust the look and feel and design to your liking.
5.1.2.1 Main Toolbar
The Dashboard Designer's Ribbon toolbar provides two page categories:
- Main pages
- Contextual pages
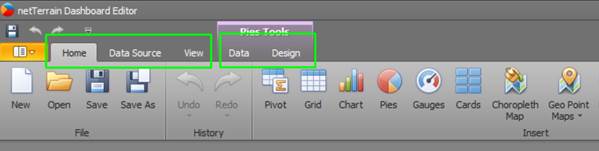
Dashboard Ribbon
The main pages are:
- Home: contains common dashboard commands allowing you to create a new dashboard and add dashboard items, add a title, save the created dashboard, etc.
- Data Source: contains commands related to creating a new data source, calculated fields and parameters
- View: allows you to switch between built-in application themes
Contextual pages contain commands related to a specific dashboard item. For instance, these commands allow you to use Pie Tools, or apply filtering to dashboard item data, perform specific layout operations, etc.
5.1.2.2 Home ribbon
The home Ribbon contains thebasic operations for creating, opening and saving dashboards as well as the widget insert, item operation and data coloring buttons:
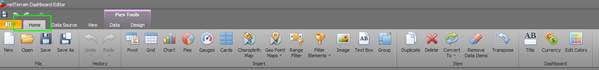
Home toolbar
5.1.2.3 Data Source Tab
The Data Source Tab allows you to navigate through dashboard data sources. It displays the data source structure and allows you to bind dashboard items to the required data source fields using drag-and-drop operations. The Data Source Browser also enables you to manage calculated fields and work with parameters.
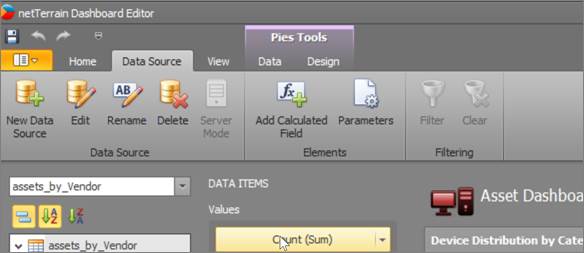
Data Source Tab
The Data Source Tab contains the following buttons.
- Data Source drop-down list - allows you to select the required data source
- Query/Data Member drop-down list - allows you to select the required query or data member
The following Command buttons are available.
The  button groups fields by type. The
  and
and  buttons are used to switch the sort order. The
  button is used to refresh the Field List.
Field List displays data source fields. You can drag these fields to the data item placeholders to specify data binding.
The Data Source Browser identifies the following data field types:
| Icon | Description |
|---|---|
|  | Boolean |
|  | Byte |
|  | Date-time |
|   | Numeric |
|  | String |
|   | Calculated field |
5.1.2.3.1 Data Items Pane
The Data Items pane is placed side-by-side with the Data Source Browser, and allows you to create and modify data binding using drag-and-drop operations.
To learn how to bind dashboard items to data source fields, see the Binding Dashboard Items to Data in the Designer topic.
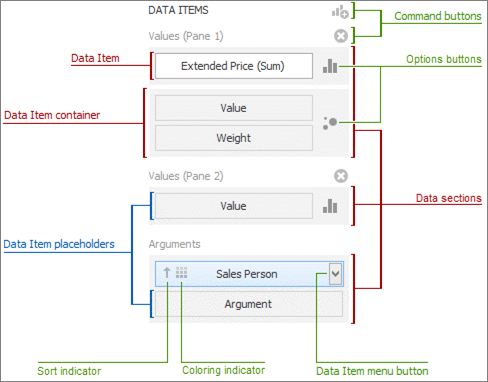
Data items pane
The Data Items pane can contain the following elements:
- Data Item placeholder: used to create data binding using drag-and-drop operations.
- Data Item: identifies data binding by mapping to a particular data source field. Each data item has the Data Item menu button, used to invoke a menu that allows you to perform various data shaping operations.
- Data Section: corresponds to a particular dashboard item area or element.
- Data Item container: used to provide data item sets (e.g., for calculating the difference between two measures). Data item containers have Options buttons that allow you to change specific dashboard item settings (e.g., to switch between chart series types or grid column types).
- Sort indicator: shows the current sort order for the data item.
- Coloring indicator: indicates whether coloring by hue is enabled for the data item.
5.1.3 View (themes) menu
To switch between different themes, you can click on the View menu and select between a variety of designed themes. Spice up your Octobers with a sassy Pumpkin theme or get romantic during the month of February with a Valentine’s theme:
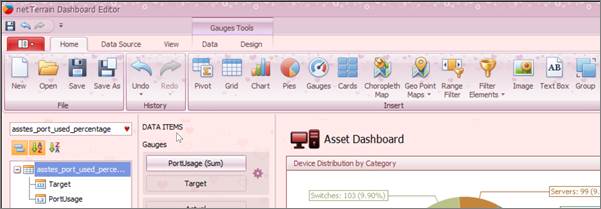
Designing dashboards can be so romantic__…
5.1.4 Dashboard Surface
The Dashboard Surface is the rectangular area displaying the dashboard that you are designing. This area includes dashboard items and the dashboard title.
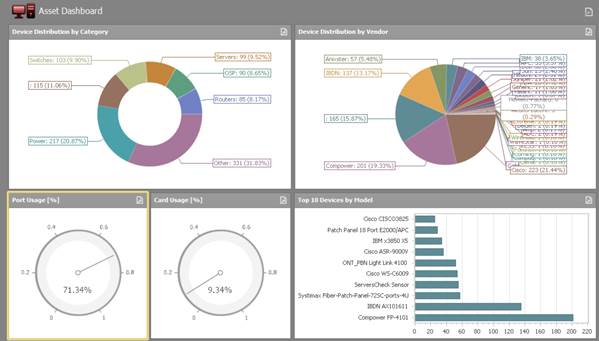
Dashboard surface
Here, you can customize a dashboard items layout using drag-and-drop operations, and specify dashboard item settings using its context menus.
5.2 Creating Data Sources
Dashboard widgets show data that is being provided from a myriad of data sources. So, before you start designing your dashboards, you need to learn how to create the underlying data sources.
5.2.1 Supported Providers
The netTerrain dashboard designer not only is able to display data from the netTerrain backend database, it can also display data from other sources such as SQL databases, Microsoft Excel workbooks, XML/CSV data files or OLAP cubes.
The following data source types are supported.
- SQL Database
- OLAP Cube
- Microsoft Excel Workbooks/CSV Files
- Entity Framework Data Source
- Object Data Source
5.2.2 Supported SQL Databases
| Database Engine | Supported Versions |
|---|---|
| Microsoft SQL Server | 2005, 2008, 2008R2, 2012, 2014 2005 Express Edition, 2008 R2 Express, 2012 Express, 2014 Express and higher. |
| Microsoft Access | 97 or higher |
| Microsoft SQL Server CE | 3.5, 4.0 |
| Oracle Database | 9i or higher |
| Teradata | 13.0 or higher |
| SAP Sybase Advantage | Advantage Database Server 9.1 or higher |
| SAP Sybase ASE | Sybase Adaptive Server 12.0 or higher |
| IBM DB2 | 9.5 or higher |
| Firebird | 1.5 or higher, Dialect 3 |
| MySQL | 4.1 or higher |
| Pervasive PSQL | 9.x or higher |
| PostgreSQL | 7.x or higher |
| VistaDB | 4, 5 |
| SQLite | 3.x |
| XML file | n/a |
| Custom connection string | n/a |
5.2.3 Creating a connection to the netTerrain database
In most cases you will use the dashboards in netTerrain to visualize native netTerrain data. It would not be very practical to have to point to the netTerrain database and provide credentials every time you want to create a new dashboard widget and pull data from netTerrain, especially considering that the netTerrain dashboards live on the same application server where netTerrain is already running and for which netTerrain already has a connection to its database through the web.config file.
As such, and for convenience, netTerrain already has a predefined internal connection that does not require you to enter any database credentials. In this section we will learn how to create a new data source using this internal connection.
1) Click the New Data Source button in the Data Source ribbon tab.
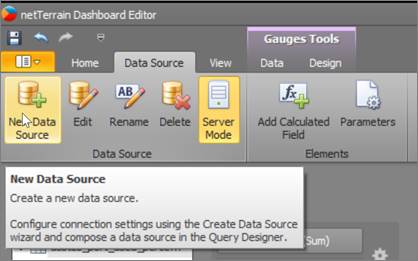
2) On the first page of the invoked Data Source Wizard dialog, type a name for your data source and click Next (you can always go back to the previous dialog using the back arrow on the top left corner).
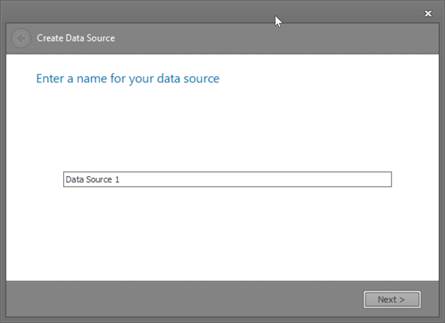
3) Next select your data connection. Notice the option to choose from a list of predefined connections. netTerrain already ships with a predefined connection called NetTerrainDefault, which is the default connection to your netTerrain database. Choose this option and hit next.
4) From here on you are now connected and working with the internal netTerrain database
Later in this section we will learn how to create queries against the netTerrain database.
5.2.4 Creating an external SQL Server Data Source
The Dashboard Designer provides the capability to connect to multiple types of SQL databases using the Data Source wizard, besides the native netTerrain database. In this section we show an example of how to connect to an external SQL Server database.
To connect to the MS SQL database in the Dashboard Designer, the first few steps are identical to what we saw before:
1) Click the New Data Source button in the Data Source ribbon tab.
2) On the first page of the invoked Data Source Wizard dialog, type a name for your data source and click Next (you can always go back to the previous dialog using the back arrow on the top left corner).
3) Next select your data connection. Here, we want to create a new connection to an external SQL Server database, choose the ‘create new connection’ option.
4) On the next page, select the Microsoft SQL Server data provider and specify the required connection parameters.
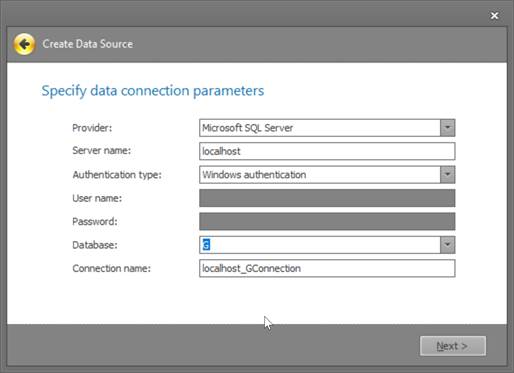
a. Specify the name of the MS SQL server to which the connection should be established.
b. Specify the authentication mode of the MS SQL Server. You can choose whether to use Windows authentication or Server authentication.
c. Specify the user name used to authenticate to the MS SQL server.
d. Specify the password used to authenticate to the MS SQL server.
e. Select the database that contains the required data.
5) After you have specified the required connection parameters, click next and specify how to select data from the database. You can select a table from the displayed list view or open the query designer after closing the wizard.
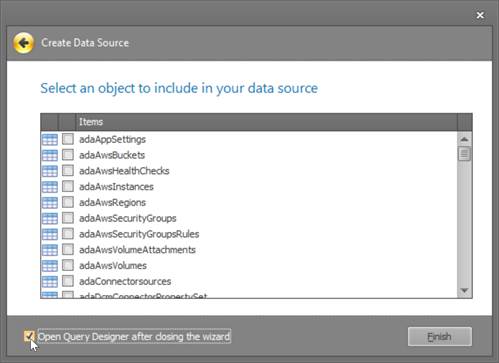
a. If you select a table from the list view, it will serve as your data source and displayed in the data sources hierarchy browser:
b. If, instead, you check the ‘Open Query designer’ option from the previous dialog, the Query designer dialog will open. We will review the query designer in the next section.
5.2.5 Using the Query Designer
When the data source is configured, you can use the built-in Query Designer to select required data.
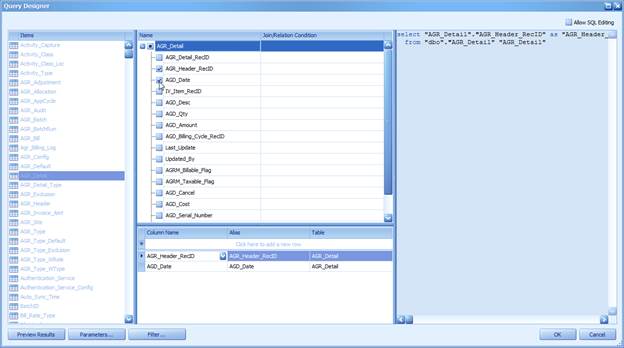
Query designer
You can select tables, which then automatically detect join/relations and conditions and provide the list of available fields to work with or you can modify the SQL string directly. Click the Allow SQL Editing check box to edit SQL statements directly. However, note that unchecking this box will cancel all your changes.
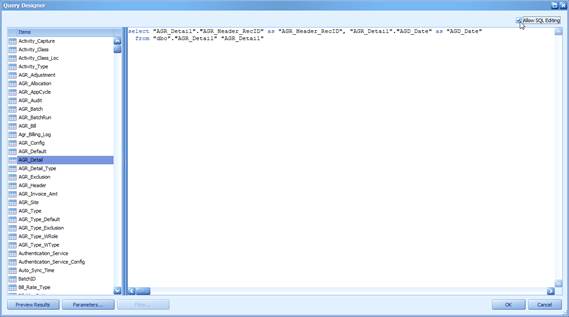
Designer with SQL editing enabled
5.2.5.1 Building Queries with the Query Designer
In the Query Designer dialog, you can add data tables and views to the data source, and select which columns to include. The Query Builder automatically joins the related tables, so all you need to do is drag-and-drop.
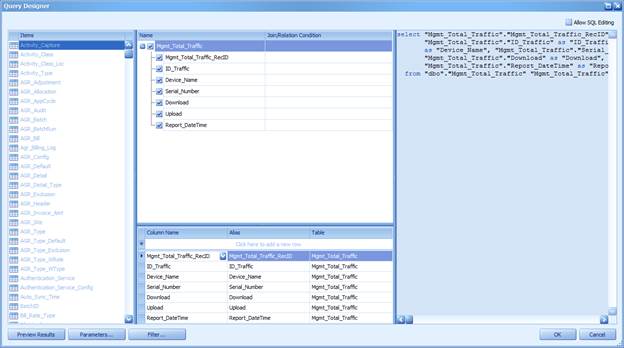
5.2.5.2 Adding Tables
To add the required tables/views to a data source, double-click the table (or view) or drag-and-drop it from the Tables pane onto the Diagram pane.
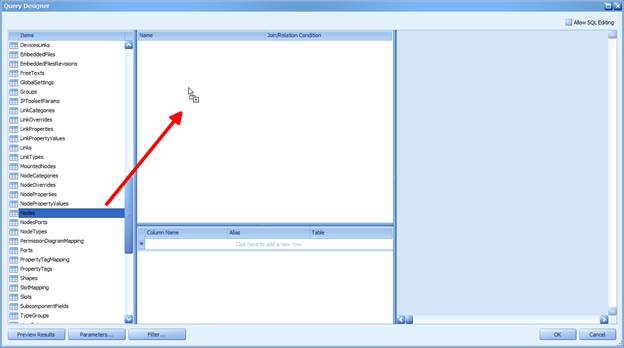
Then, select the required columns.
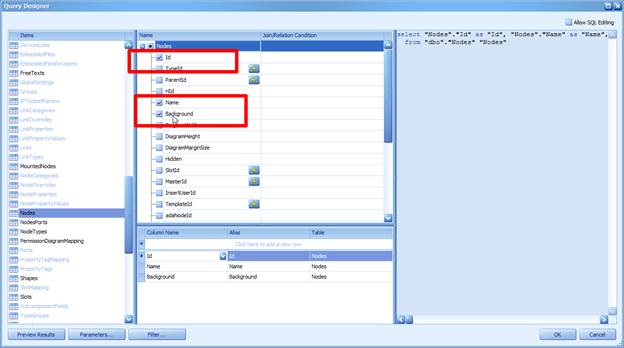
5.2.5.3 Joined Tables
Note that if at least one table has been added to the Diagram pane, the Tables pane highlights tables that have a relationship with any of the recently added tables.
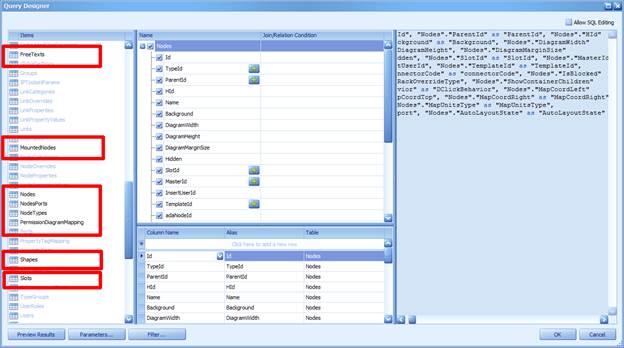
To join the already added table with another table, drag and drop the required table from Tables pane to Diagram pane. As an alternative, in a row corresponding to a foreign key column, click the + button.
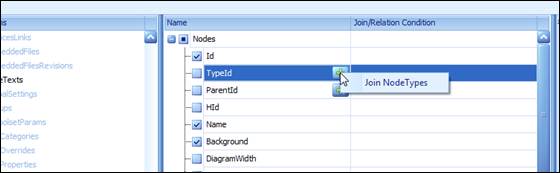
5.2.5.4 Condition Editor
When you drag and drop a second table, the editor will let you choose the join type via the Condition Editor. Please refer to the netTerrain Database Description guide for information on how to consume data from the netTerrain database.
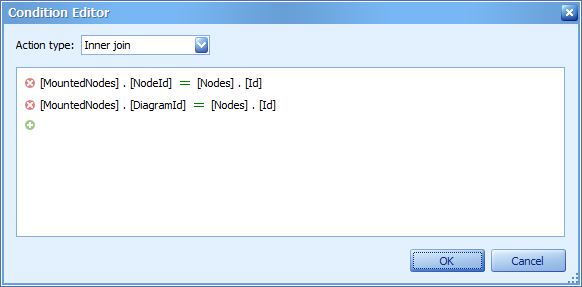
First, check the join type. You can specify it in the Join type combo box. An Inner join and Left outer join are supported.
To edit column and table names in the existing condition, click the name you wish to replace and choose a different name from the popup menu.
Columns and conditions will be automatically detected by the condition editor, as displayed below.
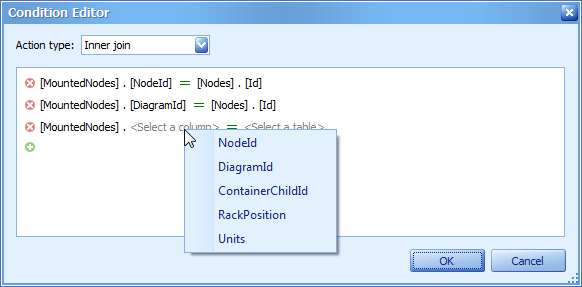
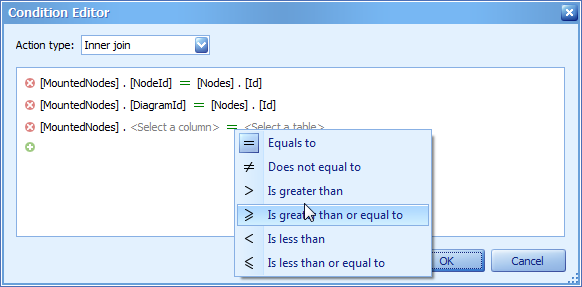
The condition editor can also be invoked by clicking on the ellipsis button next to the table header, as displayed below.
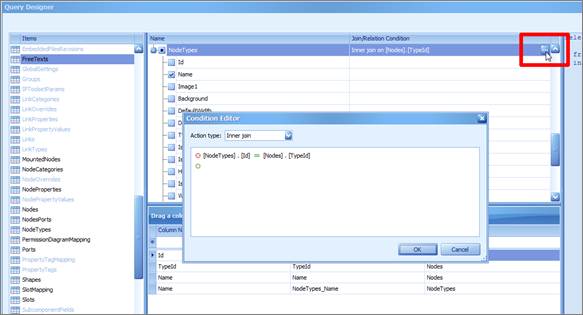
5.2.5.5 Editing column settings
After you have added the tables and selected the required columns, you can change settings for each column in the Grid pane.
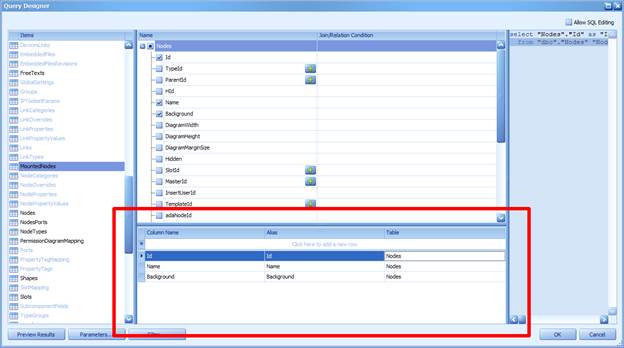
The following settings are available for each column.
- Use Column to select the required column from the combo box or add a new column.
- The Table column displays corresponding table names.
- The Alias column allows you to specify the column alias.
Right clicking on any column will reveal additional options to manipulate the fields.
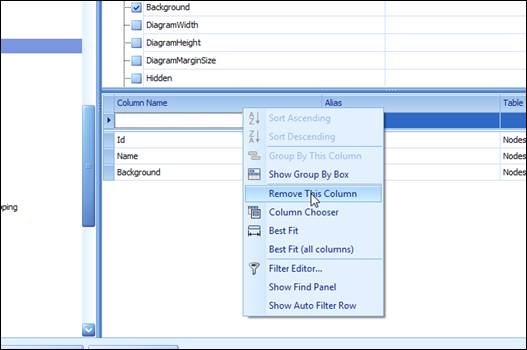
The following options are available:
- Sorting
- Group by options
- Column removal
- Column Chooser
- Column fitting
- Filtering
5.2.5.6 Deleting and Renaming Tables
To delete a table from the editor simply click on the table header and hit the ‘del’ key. You can also right click on the table header and click on the delete option.
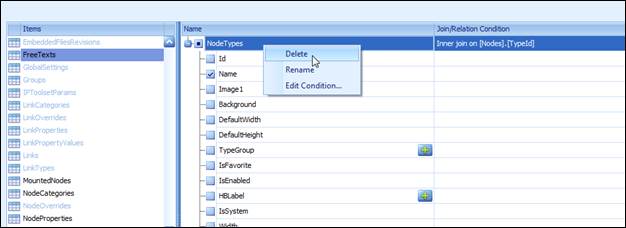
Sometimes, for convenience, you may need to rename a table. To do so simply right click on the table header and select the rename option. This will highlight the table name and let you edit it.
5.2.5.7 Previewing Results
Once the query has been designed you can easily preview the data by using the ‘Preview Results’ button.
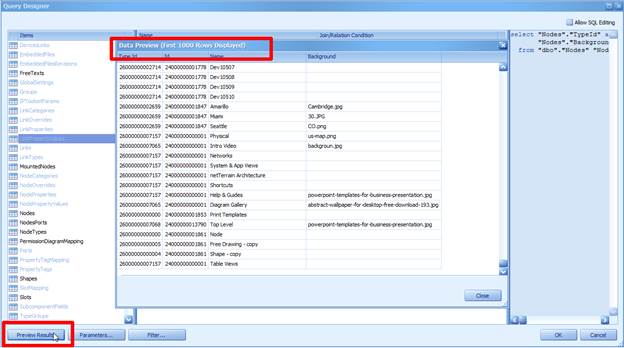
5.2.5.8 Filtering
To filter data in the Query Builder, click the Filter button, as shown below.
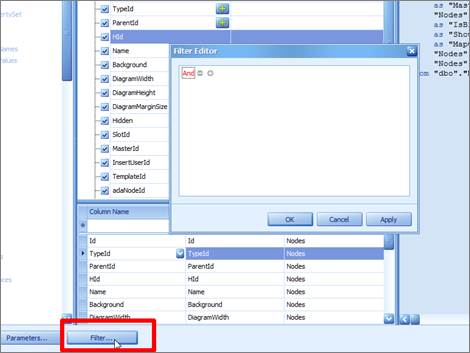
Alternatively you can right click on a column header and select the filter editor option:
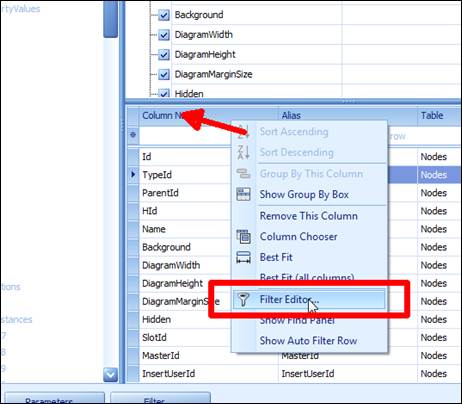
This action will invoke the Filter Editor dialog, which allows you to build filter criteria for your queries. Note that the created filter criteria will be included to the SQL query as a WHERE clause.
To create a filter, you need to specify a logical operator and a condition or group. The operators include:
- And
- Or
- Not And
- Not Or
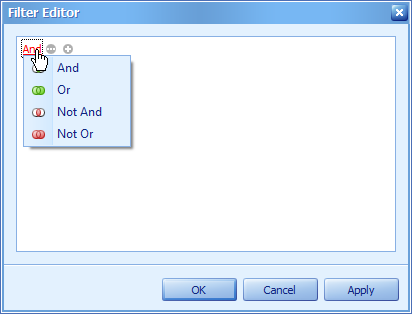
To add a condition, click on the + sign. This will display the field to compare to, an operator and a comparison value, all of which you can specify.
Clicking on the first field, you will get a drop-down box that let’s you choose other available fields, based on the tables that were brought into the dialog in previous steps.
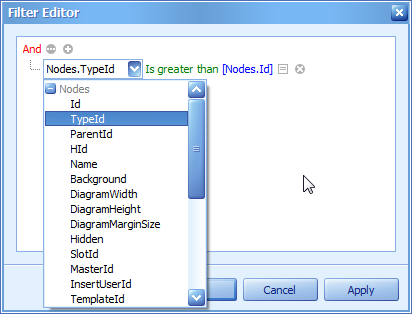
Clicking on the green operator, a drop down box with all the possible operators will be displayed.
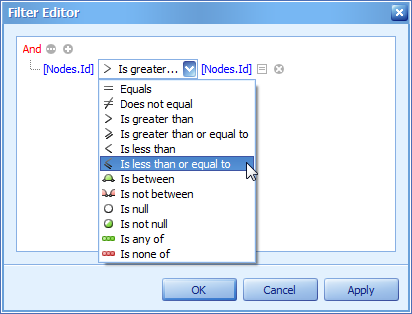
The compared value can be another field as well as a static value or parameter. Click the symbol in the Filter Editor to toggle between a value, another field and a parameter.
5.2.6 Editing connection parameters
After you connect to the data store and select the required data, you can edit the connection parameters used to establish a connection.
To edit connection parameters for the selected data source, click the Edit Connection button in the Data Source ribbon tab.
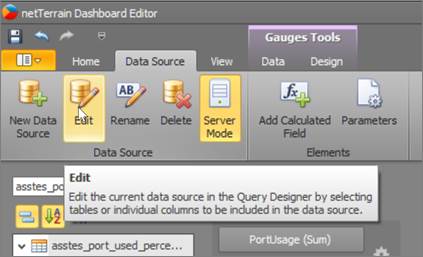
In the invoked Connection Edit dialog, you can specify new connection parameters.
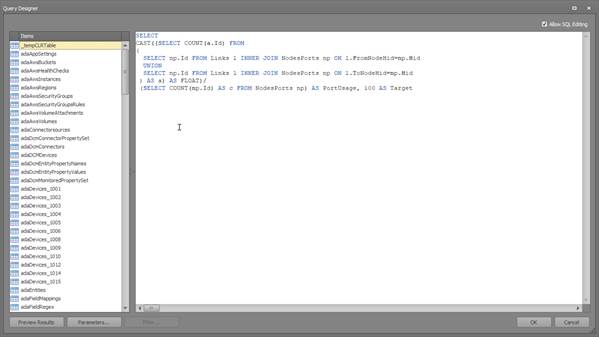
If the data source was generated by typing the SQL string in the query designer directly, the designer will automatically open the corresponding dialog for further editing.
5.2.7 Calculated Fields
The main purpose of calculated fields is to perform pre-calculations (of virtually any level of complexity) over data fields. A calculated field is similar to an ordinary data field (e.g. you can bind controls to it, and group, sort and filter your report against it).
To add a calculated field to your report, simply click on the add calculated field.
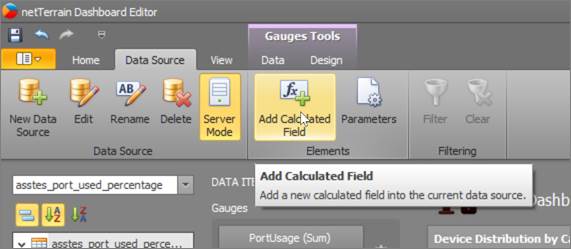
Alternatively, you can add a calculated field by right-clicking any data member, and on the invoked menu, choose Add Calculated Field.
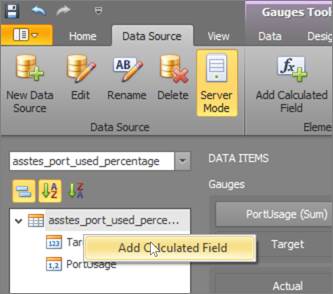
The Expression Editor allows you to edit various Boolean or regular expressions in controls:
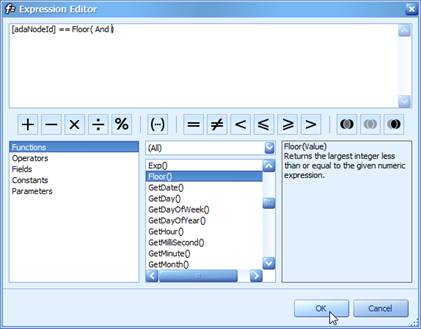
In this editor, you can type an expression manually, or select functions, operators and operands using the editor's controls.
An expression is a string that, when parsed and processed, evaluates some value. Expressions consist of column/field names, constants, operators and functions. Column/field names must be wrapped with brackets. The following are examples of regular expressions:
Boolean expressions:
The Expression Editor supports numerous standard functions, allowing you to easily perform different string, date-time, logical and math operations over data. You can access the available functions by selecting the Functions category.
Click Fields to see the field list. Double-click field names to add them to the expression string. Use the toolbar to add operators between field names.
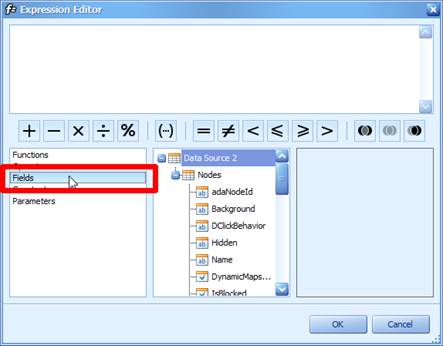
Once you created your expression, the Expression Editor will parse the construct to make sure it is valid. If the expression contains invalid symbols or other inconsistencies, you will get an error.
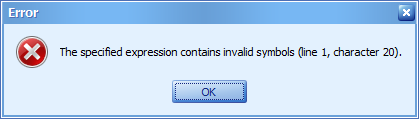
To close the dialog and save the expression, click OK.
5.2.7.1 Expression Operators
Below we describe all the existing operators that can be used in an expression.
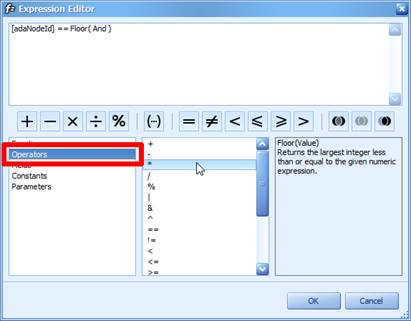
| **Operator** | Description | Example |
|---|---|---|
| + | Adds the value of one numeric expression to another, or concatenates two strings. | [FirstName] + ' ' + [LastName] [UnitPrice] + 4 |
| - | Finds the difference between two numbers. | [Price1] - [Price2] |
| * | Multiplies the value of two expressions. | [Quantity] * [UnitPrice] * (1 - [BonusAmount]) |
| / | Divides the first operand by the second. | [Quantity] / 2 |
| % | Returns the remainder (modulus) obtained by dividing one numeric expression into another. | [Quantity] % 3 |
| | | Compares each bit of its first operand to the corresponding bit of its second operand. If either bit is 1, the corresponding result bit is set to 1\. Otherwise, the corresponding result bit is set to 0. | [Flag1] | [Flag2] |
| & | Performs a bitwise logical AND operation between two integer values. | [Flag] & 10 |
| ^ | Performs a logical exclusion on two Boolean expressions, or a bitwise exclusion on two numeric expressions. | [Flag1] ^ [Flag2] |
| == | Returns true if both operands have the same value; otherwise, it returns false. | [Quantity] == 10 |
| != | Returns true if the operands do not have the same value; otherwise, it returns false. | [Country] != 'France' |
| < | Less than operator. Used to compare expressions. | [UnitPrice] < 20 |
| <= | Less than or equal to operator. Used to compare expressions. | [UnitPrice] <= 20 |
| >= | Greater than or equal to operator. Used to compare expressions. | [UnitPrice] > 30 |
| > | Greater than operator. Used to compare expressions. | [UnitPrice] >= 30 |
| In (,,,) | Tests for the existence of a property in an object. | [Country] In ('USA', 'UK', 'Italy') |
| Like | Compares a string against a pattern. If the value of the string matches the pattern, result is true. If the string does not match the pattern, result is false. If both string and pattern are empty strings, the result is true. | [Name] Like 'An%' |
| Between (,) | Specifies a range to test. Returns true if a value is greater than or equal to the first operand and less than or equal to the second operand. | [Quantity] Between (10, 20) |
| And | Performs a logical conjunction on two expressions. | [InStock] And ([ExtendedPrice]> 100) |
| Or | Performs a logical disjunction on two Boolean expressions. | [Country]=='USA' Or [Country]=='UK' |
| Not | Performs logical negation on an expression. | Not [InStock] |
5.2.7.2 Expression Functions
Below we describe all the existing functions that can be used in an expression:
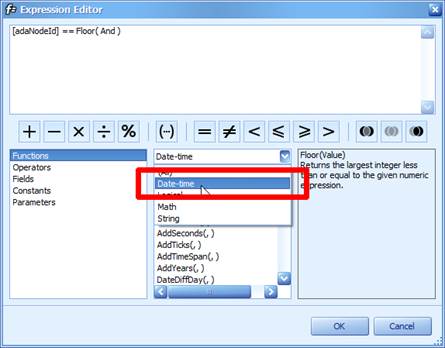
5.2.7.2.1 Date-time Functions
| Function | Description | Example |
|---|---|---|
| AddDays(DateTime, DaysCount) | Returns a date-time value that is the specified number of days away from the specified DateTime. | AddDays([OrderDate], 30) |
| AddHours(DateTime, HoursCount) | Returns a date-time value that is the specified number of hours away from the specified DateTime. | AddHours([StartTime], 2) |
| AddMilliSeconds(DateTime, MilliSecondsCount) | Returns a date-time value that is the specified number of milliseconds away from the specified DateTime. | AddMilliSeconds(([StartTime], 5000)) |
| AddMinutes(DateTime, MinutesCount) | Returns a date-time value that is the specified number of minutes away from the specified DateTime. | AddMinutes([StartTime], 30) |
| AddMonths(DateTime, MonthsCount) | Returns a date-time value that is the specified number of months away from the specified DateTime. | AddMonths([OrderDate], 1) |
| AddSeconds(DateTime, SecondsCount) | Returns a date-time value that is the specified number of seconds away from the specified DateTime. | AddSeconds([StartTime], 60) |
| AddTicks(DateTime, TicksCount) | Returns a date-time value that is the specified number of ticks away from the specified DateTime. | AddTicks([StartTime], 5000) |
| AddTimeSpan(DateTime, TimeSpan) | Returns a date-time value that is away from the specified DateTime for the given TimeSpan. | AddTimeSpan([StartTime], [Duration]) |
| AddYears(DateTime, YearsCount) | Returns a date-time value that is the specified number of years away from the specieid DateTime. | AddYears([EndDate], -1) |
| GetDate(DateTime) | Extracts a date from the defined DateTime. | GetDate([OrderDateTime]) |
| GetDay(DateTime) | Extracts a day from the defined DateTime. | GetDay([OrderDate]) |
| GetDayOfWeek(DateTime) | Extracts a day of the week from the defined DateTime. | GetDayOfWeek([OrderDate]) |
| GetDayOfYear(DateTime) | Extracts a day of the year from the defined DateTime. | GetDayOfYear([OrderDate]) |
| GetHour(DateTime) | Extracts an hour from the defined DateTime. | GetHour([StartTime]) |
| GetMilliSecond(DateTime) | Extracts milliseconds from the defined DateTime. | GetMilliSecond([StartTime]) |
| GetMinute(DateTime) | Extracts minutes from the defined DateTime. | GetMinute([StartTime]) |
| GetMonth(DateTime) | Extracts a month from the defined DateTime. | GetMonth([StartTime]) |
| GetSecond(DateTime) | Extracts seconds from the defined DateTime. | GetSecond([StartTime]) |
| GetTimeOfDay(DateTime) | Extracts the time of the day from the defined DateTime, in ticks. | GetTimeOfDay([StartTime]) |
| GetYear(DateTime) | Extracts a year from the defined DateTime. | GetYear([StartTime]) |
| Now() | Returns the current system date and time. | AddDays(Now(), 5) |
| Today() | Returns the current date. Regardless of the actual time, this function returns midnight of the current date. | AddMonths(Today(), 1) |
| UtcNow() | Returns the current system date and time, expressed as Coordinated Universal Time (UTC). | AddDays(UtcNow(), 7) |
5.2.7.2.2 Logical Functions
| Function | Description | Example |
|---|---|---|
| Iif(Expression, TruePart, FalsePart) | Returns either TruePart or FalsePart, depending on the evaluation of the Boolean Expression. | Iif([Quantity]>=10, 10, 0 ) |
| IsNull(Value) | Returns True if the specified Value is NULL. | IsNull([OrderDate]) |
| IsNull(Value1, Value2) | Returns Value1 if it is not set to NULL; otherwise, Value2 is returned. | IsNull([ShipDate], [RequiredDate]) |
| IsNullOrEmpty(String) | Returns True if the specified String object is NULL or an empty string; otherwise, False is returned. | IsNullOrEmpty([ProductName]) |
5.2.7.2.3 Math Functions
| Function | Description | Example |
|---|---|---|
| Abs(Value) | Returns the absolute, positive value of the given numeric expression. | Abs(1 - [Discount]) |
| Acos(Value) | Returns the arccosine of a number (the angle, in radians, whose cosine is the given float expression). | Acos([Value]) |
| Asin(Value) | Returns the arcsine of a number (the angle, in radians, whose sine is the given float expression). | Asin([Value]) |
| Atn(Value) | Returns the arctangent of a number (the angle, in radians, whose tangent is the given float expression). | Atn([Value]) |
| Atn2(Value1, Value2) | Returns the angle whose tangent is the quotient of two specified numbers, in radians. | Atn2([Value1], [Value2]) |
| BigMul(Value1, Value2) | Returns an Int64 containing the full product of two specified 32-bit numbers. | BigMul([Amount], [Quantity]) |
| Ceiling(Value) | Returns the smallest integer that is greater than or equal to the given numeric expression. | Ceiling([Value]) |
| Cos(Value) | Returns the cosine of the angle defined in radians. | Cos([Value]) |
| Cosh(Value) | Returns the hyperbolic cosine of the angle defined in radians. | Cosh([Value]) |
| Exp(Value) | Returns the exponential value of the given float expression. | Exp([Value]) |
| Floor(Value) | Returns the largest integer less than or equal to the given numeric expression. | Floor([Value]) |
| Log(Value) | Returns the natural logarithm of a specified number. | Log([Value]) |
| Log(Value, Base) | Returns the logarithm of a specified number in a specified Base. | Log([Value], 2) |
| Log10(Value) | Returns the base 10 logarithm of a specified number. | Log10([Value]) |
| Power(Value, Power) | Returns a specified number raised to a specified power. | Power([Value], 3) |
| Rnd() | Returns a random number that is less than 1, but greater than or equal to zero. | Rnd()*100 |
| Round(Value) | Rounds the given value to the nearest integer. | Round([Value]) |
| Sign(Value) | Returns the positive (+1), zero (0), or negative (-1) sign of the given expression. | Sign([Value]) |
| Sin(Value) | Returns the sine of the angle, defined in radians. | Sin([Value]) |
| Sinh(Value) | Returns the hyperbolic sine of the angle defined in radians. | Sinh([Value]) |
| Sqr(Value) | Returns the square root of a given number. | Sqr([Value]) |
| Tan(Value) | Returns the tangent of the angle defined in radians. | Tan([Value]) |
| Tanh(Value) | Returns the hyperbolic tangent of the angle defined in radians. | Tanh([Value]) |
5.2.7.2.4 String Functions
| Function | Description | Example |
|---|---|---|
| Ascii(String) | Returns the ASCII code value of the leftmost character in a character expression. | Ascii('a') |
| Char(Number) | Converts an integerASCIICode to a character. | Char(65) + Char(51) |
| CharIndex(String1, String2) | Returns the starting position of String1 within String2, beginning from the zero character position to the end of a string. | CharIndex('e', ‘netTerrain’) |
| CharIndex(String1, String2, StartLocation) | Returns the starting position of String1 within String2, beginning from the StartLocation character position to the end of a string. | CharIndex('e', ‘netTerrain’, 2) |
| Concat(String1, , StringN) | Returns a string value containing the concatenation of the current string with any additional strings. | Concat('A', ')', [ProductName]) |
| Insert(String1, StartPosition, String2) | Inserts String2 into String1 at the position specified by StartPositon | Insert([Name], 0, 'ABC-') |
| Len(Value) | Returns an integer containing either the number of characters in a string or the nominal number of bytes required to store a variable. | Len([Description]) |
| Lower(String) | Returns String in lowercase. | Lower([ProductName]) |
| PadLeft(String, Length) | Left-aligns characters in the defined string, padding its left side with white space characters up to a specified total length. | |
| PadLeft(String, Length, Char) | Left-aligns characters in the defined string, padding its left side with the specified Char up to a specified total length. | PadLeft([Name], 30, '<') |
| PadRight(String, Length) | Right-aligns characters in the defined string, padding its left side with white space characters up to a specified total length. | PadRight([Name], 30) |
| PadRight(String, Length, Char) | Right-aligns characters in the defined string, padding its left side with the specified Char up to a specified total length. | PadRight([Name], 30, '>') |
| Remove(String, StartPosition, Length) | Deletes a specified number of characters from this instance, beginning at a specified position. | Remove([Name], 0, 3) |
| Replace(String, SubString2, String3) | Returns a copy of String1, in which SubString2 has been replaced with String3. | Replace([Name], 'The ', '' |
| Reverse(String) | Reverses the order of elements within String. | Reverse([Name]) |
| Substring(String, StartPosition, Length) | Retrieves a substring from String. The substring starts at StartPosition and has the specified Length.. | Substring([Description], 2, 3) |
| Substring(String, StartPosition) | Retrieves a substring from String. The substring starts at StartPosition. | Substring([Description], 2) |
| ToStr(Value) | Returns a string representation of an object. | ToStr([ID]) |
| Trim(String) | Removes all leading and trailing SPACE characters from String. | Trim([ProductName]) |
| Upper(String) | Returns String in uppercase. | Upper([ProductName]) |
5.2.8 Using Parameters
You can use dashboard parameters when it is necessary to pass data of a certain type to a dashboard (e.g., to pass a specific value to the data source filter string or a calculated field).
5.2.8.1 Creating Parameters in the Dashboard Designer
To create dashboard parameters in the Dashboard Designer, do the following.
1) Click the Parameters button on the Ribbon's Home tab.
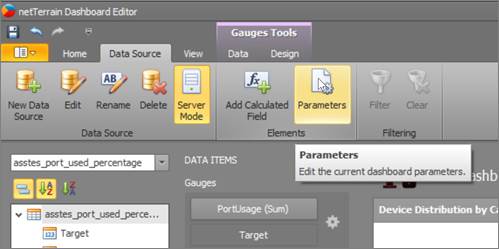
2) In the invoked dialog, click the Add button to add a new parameter.
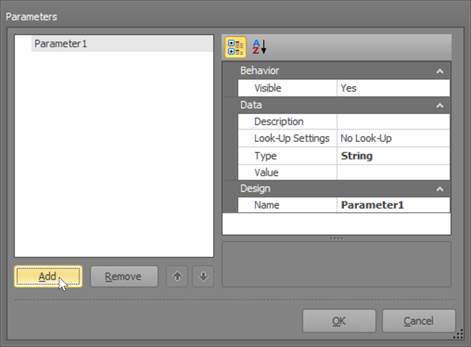
3) Specify the following settings:
| Settings | Description |
|---|---|
| **Visible** | Specifies whether or not the parameter editor is visible within the Dashboard Parameters dialog. |
| **Description** | Specifies the parameter's description displayed to an end-user. |
| **Look-Up Settings** | Specifies the parameter's look-up editor settings. |
| **Type** | Specifies the parameter type. |
| **Value** | Specifies the parameter’s value. |
| **Name** | Specifies the parameter name. |
Then, click OK to add the created parameters to the dashboard.
5.2.9 Passing Parameter Values
There are several ways to pass parameter values in the dashboard designer.
5.2.9.1 Filtering
You can filter an object data source or apply filtering to a specific dashboard item according to the current parameter value using the Filter Editor.
In the Filter Editor, you can compare a field value with the following objects.
- A static value (represented by the
 icon). Click this button to switch to the next item mode ("another field value") to compare the field value with another field value.
 - Another field value (represented by the
 icon). Click this button to switch to the next item mode (“parameter value”) to compare the field value with a parameter value.
 - A parameter value (represented by the
 icon). Click this button to switch back to the initial mode ("static value") to compare the field value with a static value.
Thus, to compare a field value with a parameter value, click the button, then click the button.
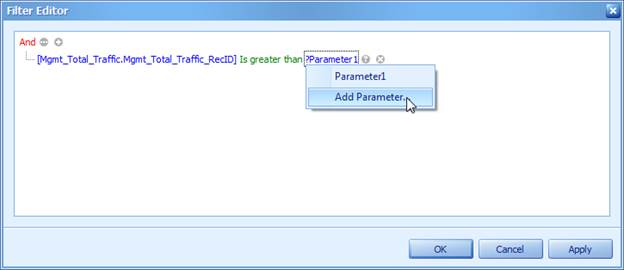
5.2.9.2 Conditional Formatting
You can apply conditional formatting to a specific dashboard item according to the current parameter value when creating the Expression format condition. In the Expression dialog, you can compare a field value with parameter values in the same manner as in the Filter Editor dialog.
5.2.9.3 Calculated Field
You can use parameters when constructing expressions for calculated fields. A parameter is inserted into the expression using the “Parameters.” prefix.
To see a list of available parameters, click Parameters in the Expression Editor dialog.
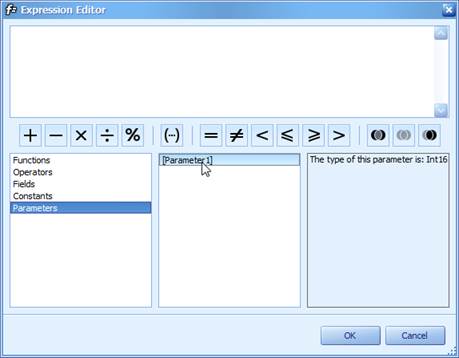
5.2.9.4 SQL Queries
The Dashboard Designer provides the capability to use a dashboard parameter as a SQL query parameter.
You can pass parameters to a data source custom SQL query in the following ways.
- To pass a dashboard parameter to a custom SQL query in the Data Source wizard or Query Editor, select the required dashboard parameter in the Value column.
- To pass a dashboard parameter to a custom SQL query call in the Query Builder, use the parameter name.
5.2.10 Deleting a Data Source
To delete a data source simply select it from the data source hierarchy browser and click on the delete button. Notice that existing widgets using this data source will still pull data in the same way. Deleting the data source will only make it unavailable for future use.
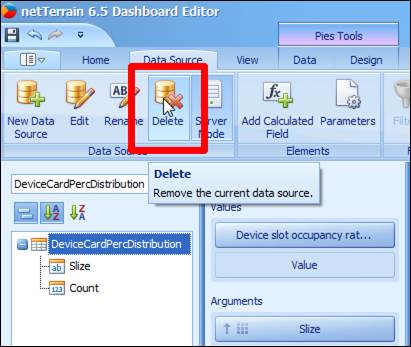
5.3 Designing Dashboards
The netTerrain Dashboard Designer provided an intuitive UI that facilitates the creation and layout of a myriad of widgets to present data in visually appealing ways. Many of these normally complex tasks can be accomplished with simple drag-and-drop operations, allowing users to start creating dashboards immediately.
5.3.1 Creating dashboard items in the dashboard surface
To create a dashboard item in the Dashboard Designer, click the corresponding button in the ribbon or the toolbar, which will place it automatically on the dashboard surface:
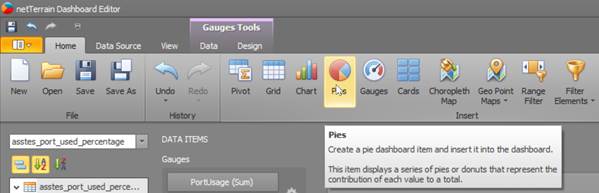
Clicking on a pie item to add it to a dashboard
This creates an empty dashboard item, and displays the required data sections for binding this item to data.
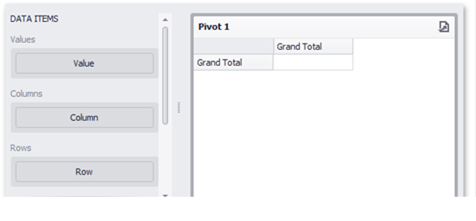
Perform the following steps to design a dashboard item:
- Bind the dashboard item to data.
- Perform the required data shaping operations (such as grouping, sorting and filtering).
- Use the interactivity features to enable interaction between various dashboard items.
- Adjust the dashboard item's position and size and specify the dashboard item caption settings.
- Specify specific dashboard item settings based on its type. To learn more, see Dashboard Items.
After you have created and designed the dashboard item, you can create an exact copy of it. To do this, click the Duplicate button in the Home ribbon tab…

or use the dashboard item's context menu. To remove the dashboard item from the dashboard, use the Delete button or the corresponding item in the context menu.
5.3.1.1 Converting Dashboard Items
The Dashboard Designer provides the capability to convert data-bound dashboard items to another type. To convert the selected dashboard item to another type, use the Convert button in the ribbon's Home tab or the corresponding command in the item's context menu.
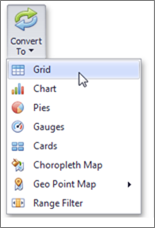
The Dashboard Designer preserves the initial set of data items in the converted dashboard item. The data shaping settings of data items and their names are also persisted.
The following dashboard item settings are preserved, if possible:
- Data item container settings (e.g., delta or sparkline settings).
- Interactivity settings (e.g., the specified master filter mode).
- Specific dashboard item settings (e.g., map extent).
5.3.2 Binding Dashboard Items to Data
To bind dashboard items to data in the Dashboard Designer, the Data Items pane is used.
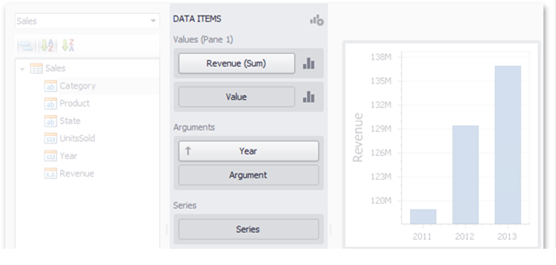
Each dashboard item type has a specific set of data sections, such as Values, Arguments and Series in the chart, Columns and Sparklines in the grid, and Values, Columns and Rows in the pivot grid. Each data section corresponds to a particular dashboard item area or element, and should be mapped to data to be displayed within this area/element.
Mapping is performed using data items - objects that are used to bind a dashboard item to data source fields. Data items are used to link the dashboard item to the required data source fields and, thus, visualize data within the dashboard item.
Another key concept in data binding is the data item container, which represents a set of data items. It can contain either a single data item or multiple data items, and allows you to specify various options related to how a specific dashboard item visualizes data.
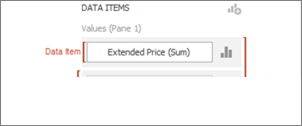
The data item can process data in two ways - as dimensions or measures. This depends on the data section to which the data item is assigned, and the type of the data item container:
- Dimension - a data item whose values are not intended to be summarized. These values can be of any type - string, date-time or numeric. In any case, the dashboard does not summarize the dimension values, but groups identical values. You can perform grouping, sorting, or display the top values for the dimension values. You can also customize data format settings for numeric and date-time values. To access the data shaping settings, use the data item's menu button.

For instance, dimensions are used to provide data for the chart argument axis, pivot grid column and row
headers.
- Measure - a data item whose values are summarized before they are used in the dashboard. These values can be of any type - numeric, date-time or string. In any case, the dashboard will calculate an appropriate summary function against measure values. You can also customize the data format settings that affect how summary values are displayed. To access these settings, use the data item's menu button.

For example, measures are used to provide data for the chart's Y-axis, and to calculate pivot cell values.
Specific data sections display Options buttons for each data item container. Use these buttons to invoke a dialog that allows you to specify the settings of this data item container. These settings affect how a particular dashboard item's area/element displays the provided data.
5.3.2.1 Binding the data
The DATA ITEMS pane displays data sections of the selected dashboard item. It can be used to add, rearrange or remove data items.
To bind a dashboard item to data, select the dashboard item. Then choose the required data field from the Data Source Browser and drop it onto the appropriate section in the Data Items pane.
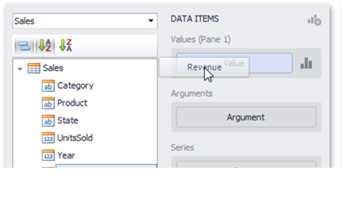
You can remove the data item by dragging it outside the Data Items pane.
To rename the data item, click its menu button and select Rename, to invoke the Rename Data Item dialog.
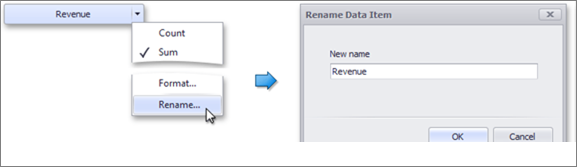
5.3.2.2 Modify Binding
You can modify data binding by dragging data item containers within a data section. To do this, drag the data item container to the required position.
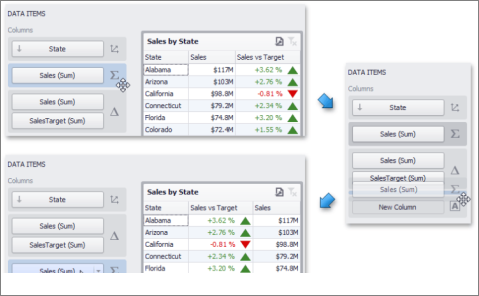
You can also modify data binding by dragging data items within the Data Items pane. This action has the following specifics:
- If you drag the data item to a new position, the settings specified for the corresponding data item container will be restored to the default values.
- If you drag the data item to an existing data item placeholder, the settings of the corresponding data item container will be applied.
5.3.2.3 Clear Binding
To remove all data items for a selected dashboard item, use the Remove Data Items button in the Home ribbon tab.
You can also do this via the dashboard item's context menu.
5.3.2.4 Hidden Data Items
The HIDDEN DATA ITEMS area allows you to perform data shaping operations by measures or dimensions that do not directly take part in the visual representation of data.
Assume that you have a dashboard containing a chart that shows average salaries in a company by department.
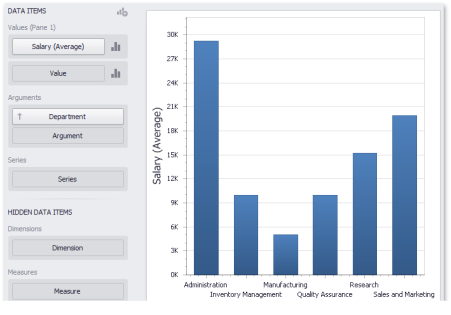
Now imagine that you need to sort departments by the number of employees. To do this, add the Employee measure to the Chart so that its data is not displayed, but only used for sorting.
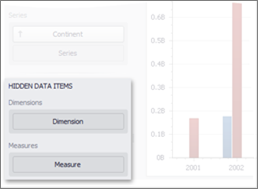
Drag-and-drop the 'Employee' data field onto the Measures section in the HIDDEN DATA ITEMS area. This will create the Employee (Count) measure, which will be available in the Sort by menu.
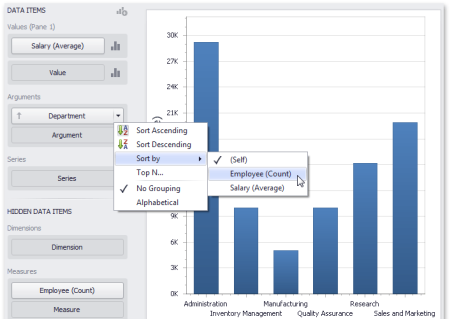
Note that the HIDDEN DATA ITEMS area is divided into two sections: Dimensions and Measures:
- Hidden dimensions appear in the Filter Editor dialog, allowing you to create filter criteria based on their values
- Hidden measures appear in the Sort by submenu (to sort dimension values by these measures), and in the Top N Values dialog (to use these measures in Top N conditions).
5.3.3 Formatting Data
Dashboard allows you to customize various data format settings for numeric and date-time values:
- Numeric Values
- Date-Time Values
- Currency Formatting Specifics
5.3.3.1 Formatting Numeric Values
To specify a format for numeric values, select Format from the data item menu.
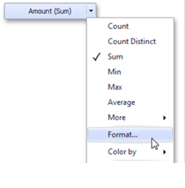
This invokes the Numeric Format window.
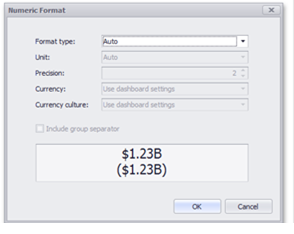
In the Format type field, select the required format type.
Auto Format settings are automatically determined based on the data type.
General Converts a number to the most compact of either fixed-point or scientific notation, depending on the type of the number.
Number Converts a number to a string of the "-d,ddd,ddd.ddd" form where "-" indicates a neg tive number symbol (if required), "d" indicates a digit (0-9), "," indicates a group separator, and "." indicates a decimal point symbol.
Currency Converts a number to a string that represents a currency amount. To learn about currency formatting specifics.
Scientific Converts a number to a string of the "-d.dddE+ddd" or "-d.ddde+ddd" form where each "d" indicates a digit (0-9).
Percent Multiplies a number by 100 and converts it to a percentage string.
Other format settings are in effect for only specific format types.
Unit The unit to which values should be converted
Precision The number of fractional digits that should be displayed
Currency Defines the currency sign and format settings that should be used to display currency values
Currency culture For currencies used in a region with several cultures, specifies the culture that defines format settings
Include group separator Specifies whether or not separators should be inserted between digit groups.
5.3.3.2 Formatting Date-Time Values
To specify a format for date-time values, use the Format submenu in the data item menu.
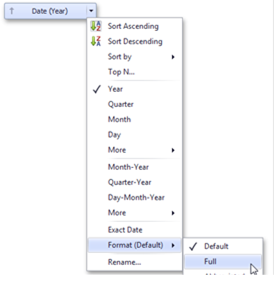
5.3.4 Interactivity
This section describes features that enable interaction between various dashboard items. These features include Master Filtering and Drill-Down.
5.3.4.1 Master Filtering
The Dashboard allows you to use any data-aware dashboard item as a filter for the entire dashboard (Master Filter). You can select elements in a Master Filter item (chart bars, pie segments, grid records, etc.) to filter data in the rest of the dashboard by the selected values.
5.3.4.1.1 Master Filtering Modes
The Master Filter item supports two selection modes.
- Multiple - Allows you to select multiple elements in the Master Filter item. To enable this mode, use the Multiple Master Filter button in the Data Ribbon tab.
To clear the selection in the Master Filter item, use the Clear Master Filter button in the dashboard item caption.

- Single - Allows you to select only one element in the Master Filter item. When this mode is enabled, the default selection will be set to a Master Filter element. You can change this selection, but cannot clear it. To enable this mode, use the Single Master Filter button in the Data Ribbon tab.
Attention!
If the selected dashboard item contains several types of elements that can be used for filtering, the Ribbon or Toolbar will provide the appropriate buttons to switch between these types (e.g., the Arguments and Series buttons for the Chart). For details, refer to the documentation for individual dashboard items in the Dashboard Items section.
5.3.4.1.2 Filtering Across Data Sources
When different items in a dashboard are bound to different data sources, you can specify that a particular Master Filter should be applied across data sources. This means that it will apply filtering to fields with matching names in all data sources.
Attention!
Fields are matched by their full names. For fields in other data sources to be affected by Master Filtering, their names must match the name of the field in the current data source, and they must belong to the same hierarchy level so that their full names also match. For instance, Customer.City and Customer.Address.City will not be treated as matching fields.
To enable filtering across data sources, use the Cross-Data-Source Filtering button in the Data Ribbon tab.
5.3.4.1.3 Preventing Items from Being Filtered
You can prevent specific dashboard items from being affected by Master Filters, so that Master Filtering will never be applied to them. To do this, use the Ignore Master Filters button in the Data Ribbon tab (or the button if you are using the toolbar menu).
5.3.4.2 Drill-Down
Dashboard provides the drill-down feature, which allows you to change the detail level of data displayed in a dashboard item. This feature allows you to drill down to display the details, or drill up to view more general information.
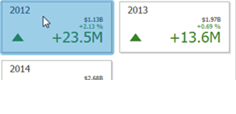
Drill-down requires that the data section contains several dimensions:
To enable drill-down, use the Drill Down button in the Data Ribbon tab:
Attention!
If the selected dashboard item contains several types of elements that can be used for drill-down, the Ribbon or Toolbar will provide the appropriate buttons to switch between these types (e.g., Arguments and Series buttons for the Chart).
To return to the previous detail level (drill up), use the Drill Up button in the dashboard item's caption or in the context menu.

5.3.5 Coloring
The Dashboard Designer provides the capability to manage coloring of dashboard item elements. You can choose whether to use a global color scheme providing consistent colors for identical values across the dashboard or a local color scheme that provides an independent set of colors for each dashboard item. The Dashboard Designer also allows you to edit colors automatically assigned from the default palette.
5.3.5.1 Coloring Concepts
The Dashboard Designer provides the capability to color dashboard item elements by associating dimension values/measures and specified colors. You can choose whether to use a global color scheme to provide consistent colors for identical values or specify a local color scheme for each dashboard item.
The dashboard provides two ways for coloring dashboard item elements:
- Using a global color scheme that provides consistent colors for identical values across the dashboard. The image below shows the dashboard containing Pie and Chart dashboard items. Pie segments and chart series points corresponding to 'Bevereges', 'Condiments' and 'Diary Products' dimension values are colored using identical colors from the default palette.
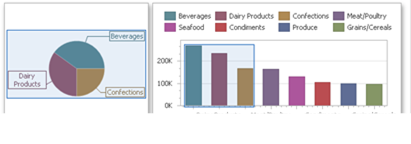
To use global colors for coloring dashboard item elements, click the Global Colors button in the Design ribbon tab.
- Using a local color scheme that provides an independent set of colors for each dashboard item. To use local colors for coloring dashboard item elements, click the Local Colors in the Design ribbon tab.
When a local color scheme is used, the dashboard reassigns palette colors when the filter state is changed.
Attention!
By default, the dashboard colors dimension values/measures use the default palette that contains 20 unique colors.
5.3.5.1.1 Coloring Dimensions and Measures
Dashboard items allow you to manage coloring individual dimensions or all dashboard item measures using predefined coloring modes:
- Default - Dimension values/measures are colored by default.
- Hue - Dimension values/measures are colored by hue. If coloring by hue is enabled, a data item indicates this using the
 indicator.
 - None - Dimension values/measures are colored with the same color.
5.3.5.1.2 Coloring Dimension Values
To specify the coloring mode for the required dimension, click the dimension's menu button and use the Color by submenu. For instance, the image below shows the Chart dashboard item whose 'Country' dimension is colored by hue.
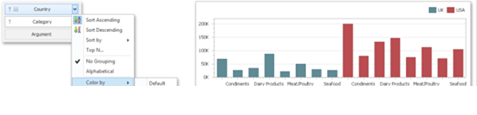
5.3.5.1.3 Coloring Measures
To specify the coloring mode for dashboard item measures, click the menu button of any measure and use the Color by submenu. For instance, the image below shows the Pie dashboard item whose measures are colored by hue.
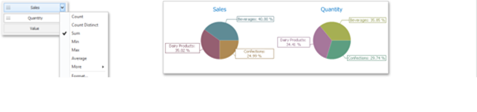
If you enabled coloring by hue for several dimensions/measures, all combinations of dimension values/measures will be automatically colored using different colors from the default palette.
5.3.5.2 Customizing a Color Scheme
The Dashboard Designer provides the capability to edit colors contained in global and local color schemes. You can select the required color from the default dashboard palette or specify a custom color:
- Invoke a Color Scheme Dialog
- Edit Colors
- Add a New Value
- Add a New Color Table
5.3.5.2.1 Invoke a Color Scheme Dialog
To edit colors, use the Color Scheme dialog. You can invoke this dialog in the following ways.
- To edit colors in a global color scheme, use the Edit Colors button in the Home ribbon tab or the Edit Colors button in the dashboard item's Design tab.
- To edit colors in a local color scheme, use the Edit Colors button in the contextual Design ribbon tab.
Let’s consider a Chart dashboard item whose dimensions and measures are colored by hue using local colors.
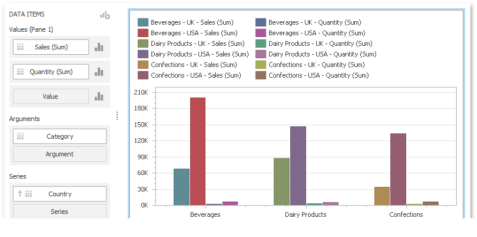
For this dashboard item, the Color Scheme dialog will contain combinations of all dimension values and a specific measure.
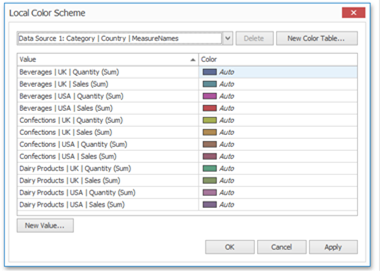
In this dialog, you can perform the following actions:
- Edit automatically assigned colors or specify new colors.
- Add new values to a color table.
- Add new color tables containing values whose colors are not yet assigned.
5.3.5.2.2 Edit Colors
You can customize automatically assigned colors in several ways:
- To retain the automatically assigned color for the selected value, right-click the required value in the Value column and select Retain this color.
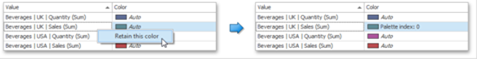
This reserves the current palette color for the selected value.
- You can select another palette color by clicking the required cell in the Color column.
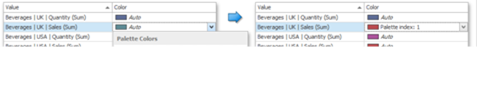
- To specify a custom color, click More Colors and pick any color using the RGB or HSB color model in the invoked Select Color dialog.
5.3.5.2.3 Add a New Value
The Color Scheme dialog allows you adding a new value with the specified color to the selected color table. To do this, click the New Value button:
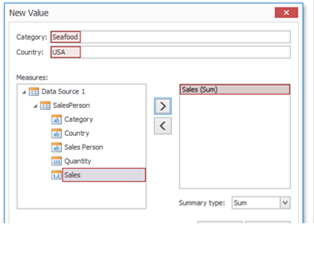
In the invoked New Value dialog, specify the dimension values, add the required measures and click Save. This creates a new value whose color can be specified as described in Edit Colors.
You can remove manually added values using the Remove context menu item.
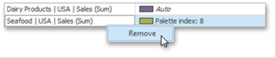
5.3.5.2.4 Add a New Color Table
The Color Scheme dialog also allows you to add a new color table containing values whose colors are not yet assigned. To do this, click New Color Table button:
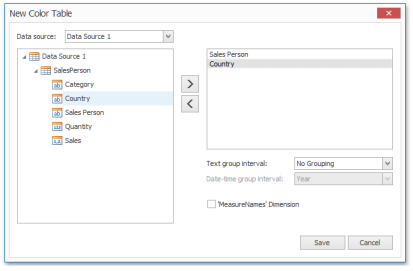
In the invoked dialog, specify the data source, add the required dimensions and enable the 'MeasureNames' Dimension check-box if you need to add measures to a color table.
Click Save to add the color table to a color scheme. Then, you can add values to this table.
5.3.6 Dashboard layout principles
This section describes the features related to the Dashboard layout process, including:
- Titles
- Laying out items
- Captions
5.3.6.1 Dashboard Title
The Dashboard Title is located at the top of the dashboard surface. It can contain text or image content.
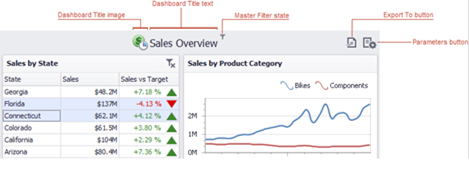
If you are using the Ribbon menu in the Dashboard Designer, you can change title settings by clicking the Title button.

This invokes the Dashboard Title dialog, which allows you to change the text within the dashboard title, add an image, etc.
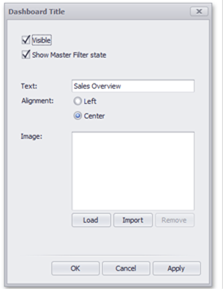
This dialog allows you to specify the following options:
- Visible - Specifies whether or not the dashboard title is visible.
- Show Master Filter state - Specifies whether or not to show the state of master filter items in the dashboard title. When an end-user hovers over the filter icon ( ), all master filters applied to the dashboard are displayed in the invoked popup.

- Alignment - Specifies the alignment of the dashboard title.
- Load button - Allows you to specify the image displayed within the dashboard title. In this case, the dashboard definition will contain the URL to access the image. Import button - Allows you to specify the image displayed within the dashboard title. In this case, the dashboard definition will contain an image as a byte array.
The dashboard title can contain command buttons:
- Export To button - allows you to print/export the dashboard.
- Parameters button - allows you to modify dashboard parameter values.
5.3.6.2 Dashboard Items Layout
The Dashboard Designer provides the capability to arrange and resize dashboard items in various ways, using simple drag-and-drop operations.
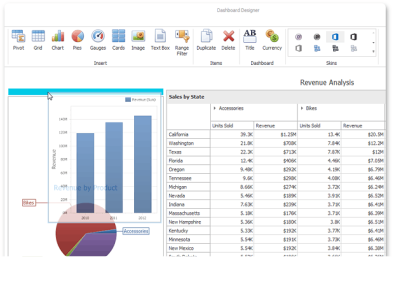
5.3.6.2.1 Item Resizing
You can resize individual items by dragging their edges.
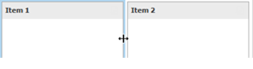
You can also manage resizing 2x2 groups of items using the indicator at the group intersection.
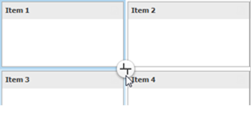
You can switch between different modes by clicking this indicator.
5.3.6.2.2 Item Positioning
You can change the position of a dashboard item via drag-and-drop, using one of the following approaches:
- If the caption of the dashboard item is visible, click it and hold down the left mouse button while dragging the item.
- If the caption of the dashboard item is not visible, click the
 icon in the top left corner, and drag the item to its new position.
The drag-and-drop indicator shows possible positions for the dashboard item

and sequentially displays areas that the dashboard item can occupy. The image below illustrates how a dashboard item is dragged.
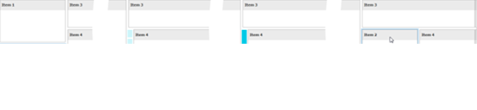
5.3.6.2.3 Dashboard Item Caption
Each dashboard item has a caption that is displayed at the top of the item. The caption contains static text along with other information, as well as command buttons.
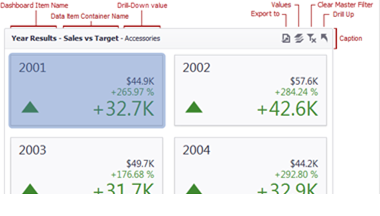
To show or hide the caption of a dashboard item, click the Show Caption button in the Design Ribbon tab
or right-click the item when designing the dashboard, and click the Show Caption menu item.
The caption of the Dashboard item contains the following information and buttons, depending on the dashboard item type:
-
Names:
-
Dashboard Item Name - represents the static text within a dashboard item's caption.
- Data Item Container Name - represents the name of the data item container. To learn more about data item containers, see the Providing Data topic for the corresponding dashboard item.
You can change the default name of the dashboard item or data item container using the Edit Names dialog. To invoke this dialog, right-click the item when designing the dashboard, and click the Edit Names menu item (alternatively, you can use the Edit Names button in the Design Ribbon tab).
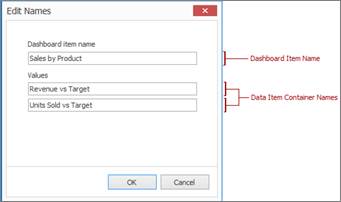
- Interactivity Information: Drill-Down value - shows the value or values from the current drill-down hierarchy.
-
Command Buttons:
-
Export to button - allows you to print or export a dashboard item.
- Values button - invokes a drop-down menu that allows you to switch between the provided values (in the pie, card, gauge and map dashboard items).
- Clear Master Filter button - allows you to reset filtering when a dashboard item acts as the Master Filter.
- Drill Up button - allows you to return to the previous detail level when the drill-down capability is enabled for this item.
5.3.6.3 Undo and Redo Operations
The Dashboard Designer keeps track of all user actions, and allows you to undo or repeat them using the Undo/ Redo buttons:

To undo/redo the last action, use the following buttons.


To undo/redo several actions at once, click the arrow next to Undo/Redo button and select the actions in the list that you want to undo/redo.
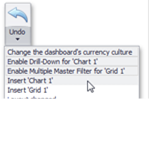
5.3.6.4 Storing Dashboards
A dashboard provides the capability to save a dashboard definition (dashboard items, data sources, data binding, layout settings, etc.) to an XML file, and restore the dashboard from an XML file.
5.3.6.4.1 Saving a Dashboard Definition
Once a dashboard is designed, you can save its definition to an XML file. In the Dashboard Designer, this can be accomplished in the following ways:
- You can save the dashboard definition by clicking the Save or Save As button in the Ribbon menu of the Designer.
This invokes the Save As dialog, which allows you to locate the folder in which you wish to store your file.
- The dashboard definition can be saved when the window containing the Dashboard Designer is closed. If the dashboard has been modified since the last save, a save confirmation dialog will be invoked.
5.3.6.4.2 Loading a Dashboard Definition
A dashboard definition previously saved to an XML file can be loaded to the Dashboard Designer. You can open the dashboard definition by clicking the Open button in the Ribbon menu of the Designer
This invokes the Open File dialog, which allows you to locate the required dashboard XML file.
5.4 Dashboard Widgets
Dashboard widgets can be divided into the following groups:
- Pivot: The Pivot dashboard item displays a cross-tabular report that presents multi-dimensional data in an easy-to-read format.
- Grid: The Grid item displays a table with rows and columns
- Chart: A Chart is a series of bars that represent data, typically in an x/y style coordinate system.
- Pie: The Pie dashboard item displays a series of pies or donuts that represent the contribution of each value to a total.
- Gauge: The Gauge dashboard item displays a series of gauges. Each gauge can communicate two values - one with a needle and the other with a marker on the scale.
- Card: The Card dashboard item displays a series of cards. Each card illustrates the difference between two values. This difference can be expressed as an absolute value, an absolute variation or a percentage variation.
- Choropleth Map: The Choropleth Map dashboard item allows you to colorize the required areas in a map in proportion to the provided values.
- Range Filter: The Range Filter dashboard item allows you to apply filtering to other dashboard items. This item displays a chart with selection thumbs that allow you to filter out values displayed along the argument axis.
- Image: static image that can be added as a widget
- Text: Free text that can be added to a dashboard
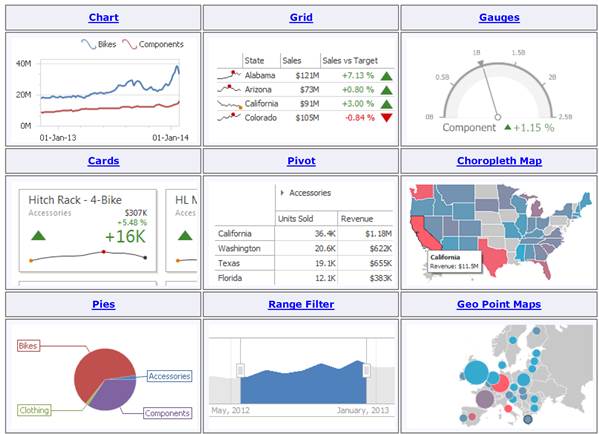
Common dashboard widgets
In the following sections we will review some of the main widgets utitlized in netTerrain dashboards.
5.4.1 Charts
We have all seen charts before: time-series (or some other function) usually represented by bars, lines or points, on a coordinate system, visualizing data that can give us insights into a set of data.
The topics in this section describe the features available in the Chart dashboard item, and provide extensive information on how to create and customize charts in the Dashboard Designer.
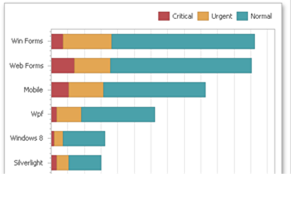
Chart example
This section is divided into the following subsections:
- Providing Data - Provides information on how to supply the Chart dashboard item with data.
- Series - Enumerates and describes different types of series that can be displayed within the Chart dashboard item.
- Panes - Introduces the concept of chart panes (visual areas within a diagram that display chart series), and provides information on how to create them.
- Interactivity - Describes features that enable interaction between the Chart and other dashboard items.
- Axes - Describes how to customize settings related to chart axes.
- Legend - Provides information about the chart legend and its options.
- Orientation - Describes how to toggle the chart's orientation.
5.4.1.1 Providing Data
This topic describes how to bind a Chart dashboard item to data in the Dashboard Designer.
The Dashboard Designer allows you to bind various dashboard items to data in a virtually uniform manner (see Binding Dashboard Items to Data for details). The only difference is in the data sections that these dashboard items have.
5.4.1.1.1 Data Sections
The Chart dashboard item has the following data sections:
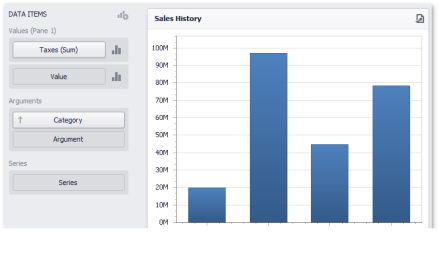
- Values - The Values section contains data items whose values are used to calculate the Y-coordinates of data points.
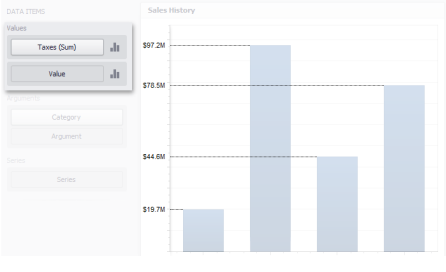
- Arguments - The Arguments section contains data items that provide values displayed along the X-axis of the chart.
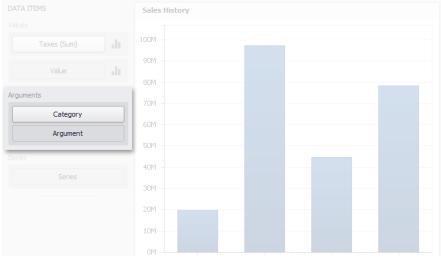
- Series - The Series section contains data items whose values are used to create chart series.
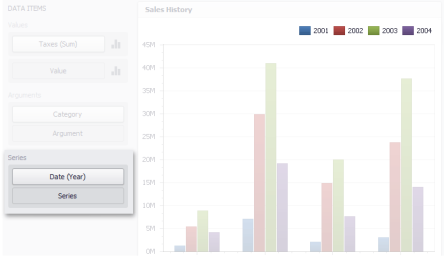
5.4.1.1.2 Transposition
The Chart dashboard item provides the capability to transpose chart arguments and series. In this case, data items contained in the Arguments section are moved to the Series section, and vice versa. To transpose the selected Chart dashboard item, use the Transpose button in the Home ribbon tab.
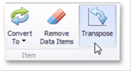
5.4.1.2 Series
This section describes how to select a desired series type in the overview topic, and lists the variety of available series types.
5.4.1.2.1 Series Overview
The Chart dashboard item supports a variety of series types - from simple bar and line charts to complex candle stick and bubble graphs:
- Bar Series
- Point and Line Series
- Area Series
- Range Series
- Weighted Series
- Financial Series
To switch between series types in the Designer, click the options button next to the required data item (or placeholder) in the Values section. In the invoked Series Type dialog, select the required series type and click OK.
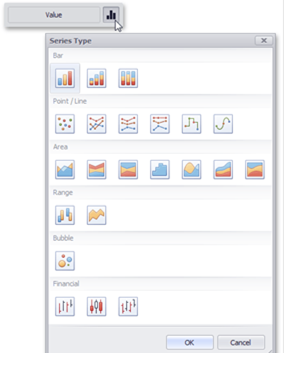
You can also do this using the Series Type gallery in the Design Ribbon tab.
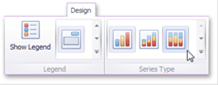
5.4.1.2.2 Bar Series
A Bar series displays data as sets of rectangular bars with lengths proportional to the values that they represent:
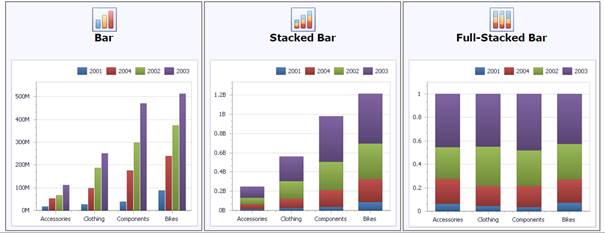
5.4.1.2.3 Point and Line Series
Point and Line series display data as standalone points or points joined by a line:
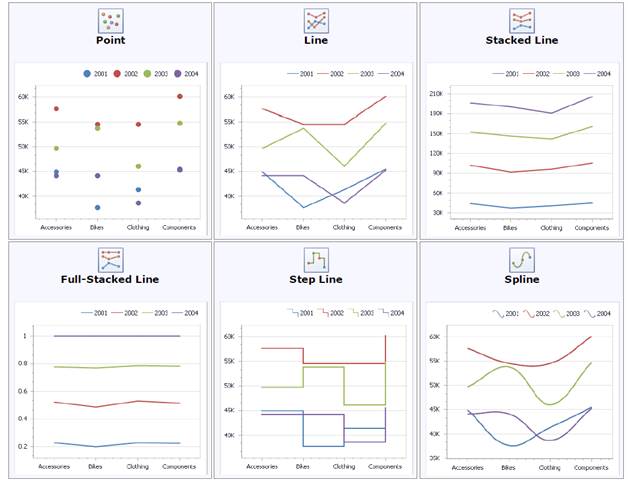
5.4.1.2.4 Area Series
An Area series displays data by a line that joins points, and the shaded area between the line and the argument axis.
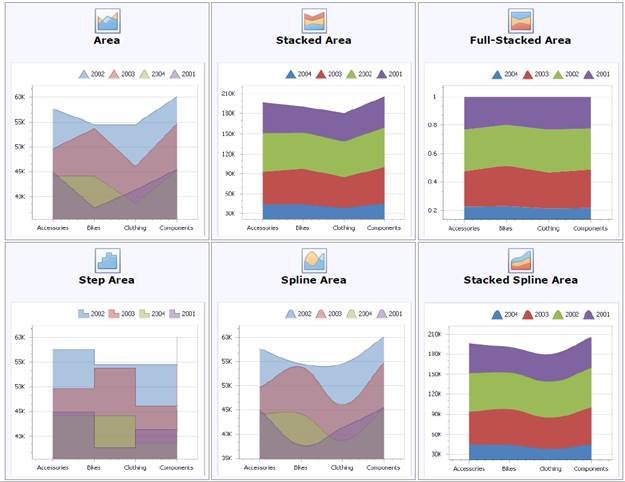
5.4.1.2.5 Range Series
A Range series is the area between two simple series displayed as a shaded area (Range Area), or bars that stretch from a point in one series to the corresponding point in another series (Range Bar).
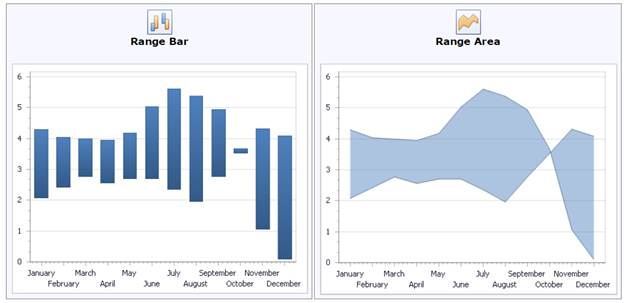
Because a range series represents the area between two simple series, you need to provide two measures instead of one to display a range series:
- Value 1 - a measure for calculating the first set of values.
- Value 2 - a measure for calculating the second set of values.
When you select the Range Bar or Range Area series type in the Designer, the DATA ITEMS area displays two data item placeholders.
5.4.1.2.6 Weighted Series
A Weighted series displays data using a third dimension, expressed by a bubble's size.
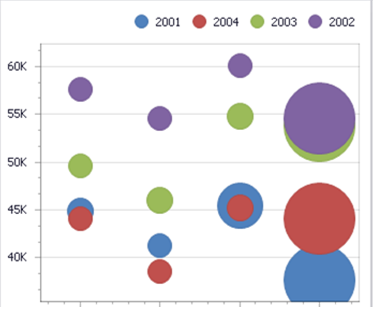
Data points in a weighted series present the following two measures:
- Value - the Y-coordinate of series points
- Weight - the size of series points.
When you select the Bubble series type in the Designer, the DATA ITEMS area displays two data item placeholders.
5.4.1.2.7 Financial Series
They may not be directly related with routers, cables or netTerrain elements, but the Financial series are still available for you to use in situations where you bring in financial data from other systems.
5.4.1.3 Panes
Chart dashboard items can contain any number of panes. Panes are visual areas within a diagram that display chart series.
Each pane has its own Y-axis, and displays a specific set of series. All panes in a chart share the same X-axis.
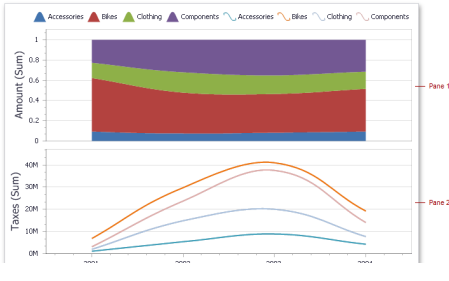
To add a pane, click the  button at the top right of the DATA ITEMS area.
Once a new pane is added, the Dashboard Designer creates another Values section in the DATA ITEMS area.
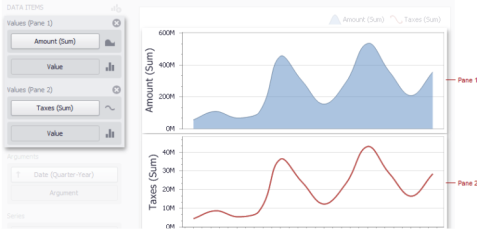
Use this section to provide data items that supply values to be displayed in the new pane (see Binding Dashboard Items to Data for details on data binding).
To remove a pane, click the  button displayed in the corresponding Values section.
5.4.1.4 Interactivity
This section describes features that enable interaction between the Chart and other dashboard items. These features include Master Filtering and Drill-Down.
5.4.1.4.1 Master Filtering
The Dashboard designer allows you to use any data-aware dashboard item as a filter for the entire dashboard (Master Filter). To learn more, see the Master Filtering topic, which describes filtering concepts common to all dashboard items.
The Chart dashboard item supports filtering by argument or series values.
When filtering by arguments is enabled, you can click series points to make other dashboard items only display data related to selected argument values.
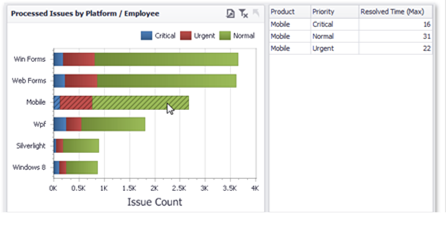
To enable filtering by arguments in the Designer, set the required Master Filter mode and click the Arguments button in the Data Ribbon tab.

When filtering by series is enabled, you can click a series point to make other dashboard items only display data related to the selected series.
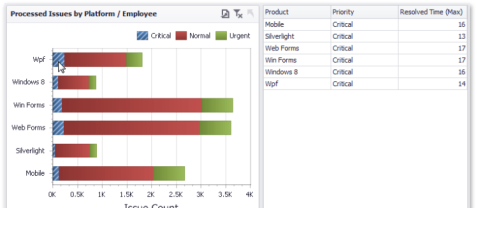
To enable filtering by series in the Designer, set the required Master Filter mode and click the Series button in the Data Ribbon tab.

To reset filtering, use the Clear Master Filter button in the Chart's caption area
or the corresponding command in the Chart's context menu.
5.4.1.4.2 Drill-Down
The built-in drill-down capability allows you to change the detail level of data displayed in dashboard items on the fly. To learn more about drill-down concepts common to all dashboard items, see the Drill-Down topic.
The Chart dashboard item supports drill down on argument or series values.
When drill down on arguments is enabled, you can click a series point to view a detail chart for the corresponding argument value.
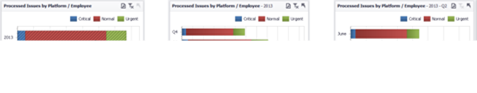
Drill down on arguments requires that the Arguments section contains several data items, from the least detailed to the most detailed item.
To enable drill down on arguments, click the Drill Down button in the Data Ribbon tab…
and the Arguments button.
When drill down on a series is enabled, you can click a series point (or corresponding legend item) to view a detail chart for the corresponding series.
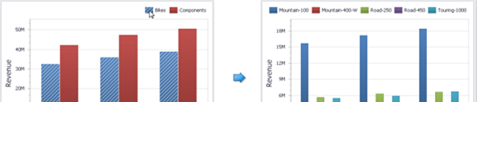
Drill down on a series requires that the Series section contains several data items, from the least detailed to the most detailed item.
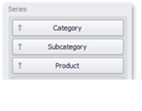
To enable drill down on a series, click the Drill Down button in the Data Ribbon tab…
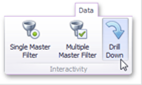
and the Series button.
To return to the previous detail level (drill up), use the Drill Up button within the Chart caption or in the context menu.
5.4.1.5 Legends
A legend is an element of a chart that identifies its series.
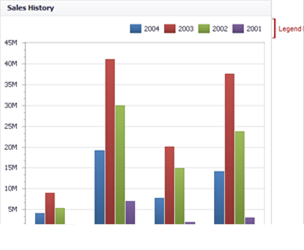
5.4.1.5.1 Visibility
You can specify whether or not a chart should display a legend. In the Designer, use the Show Legend button in the Legend section of the Design Ribbon tab.
5.4.1.5.2 Position and Orientation
To specify the legend's position and orientation, select one of the predefined options from the gallery in the Design Ribbon tab.
5.4.1.6 Axes
The Chart dashboard item displays two axes by default: the X-axis and the Y-axis.
5.4.1.6.1 X-Axis
The X-axis is the axis of arguments.
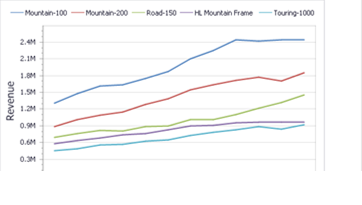
To access X-axis settings, use the X-Axis Settings button in the Diagram section of the Design Ribbon tab.

This will invoke the X-Axis Settings dialog.
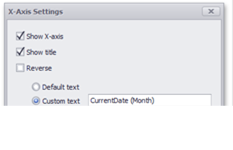
If the dimension in the Arguments section contains numeric data, the Chart can create either a continuous X-axis or a discrete X-axis.
5.4.1.6.2 Y-Axis
The Y-axis is the numerical axis of values.
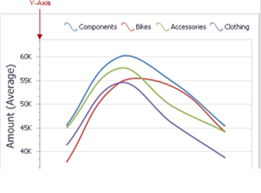
To access the Y-axis settings, use the Y-Axis Settings button in the Diagram section of the Design Ribbon tab.

This will invoke the Y-Axis Settings dialog. 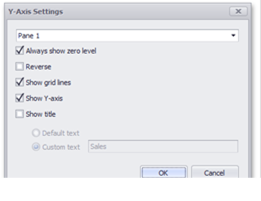
5.4.1.7 Orientation
You can rotate the Chart so that the X-axis becomes vertical, and the Y-axis becomes horizontal.
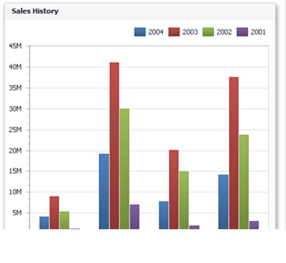
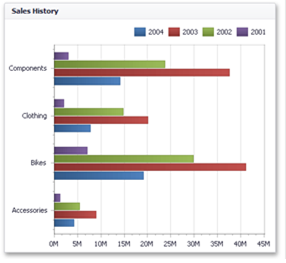
To rotate a Chart in the Designer, use the Rotate button in the Diagram group of the Design Ribbon tab.

5.4.2 Grids
As we know already, the Grid item displays a table with rows and columns. It can be quite a rich table, though, including columns using measures, dimensions, lines and more, as the image below suggests:
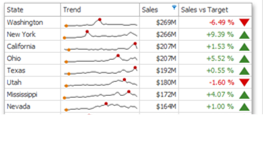
Grid example
This section is divided into the following subsections:
- Providing Data - Provides information on how to supply the Grid item with data.
- Columns - Describes different types of grid columns.
- Interactivity - Describes features that enable interaction between the Grid and other dashboard items.
- Layout - Describes the Grid's layout options.
- Style - Describes the Grid's style settings.
5.4.2.1 Providing Data
This topic describes how to bind a Grid dashboard item to data using the Dashboard Designer.
The Dashboard Designer allows you to bind various dashboard items to data in a virtually uniform manner (see Binding Dashboard Items to Data for details). The only difference is in the data sections that these dashboard items have.
The Grid dashboard item has the Columns and Sparkline data sections, which are used to provide data items based on the columns that are created.
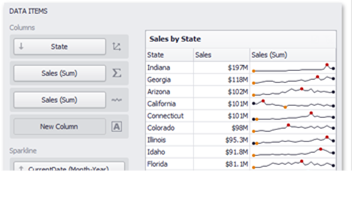
5.4.2.2 Columns
The topics in this section describe the different types of grid columns, and contain information on when to use each column type and how to customize them based on the type.
This section consists of the following topics:
- Column Type Overview: Provides general information about column types and describes how to change the type of a particular column.
- Dimension Column: Describes dimension column specifics.
- Measure Column: Describes measure column specifics.
- Delta Column: Describes delta column specifics.
- Sparkline Column: Describes sparkline column specifics.
5.4.2.2.1 Column Type Overview
The Grid dashboard item supports four types of columns:
- Dimension Column: Displays values in the bound data item "as is".
- Measure Column: Displays summaries calculated against data in the bound data item.
- Delta Column: Bound to two measures, it calculates summaries for both measures, and displays the difference between these summaries.
- Sparkline Column: Displays values in the bound data item using sparklines.
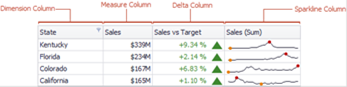
When you drop a data item into the Columns section, the type for the new column is determined automatically, based on the data type.
The type of the column is indicated within the corresponding data item container in the DATA ITEMS area.
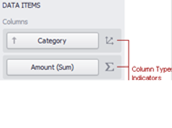
Column type indicators are defined as follows:
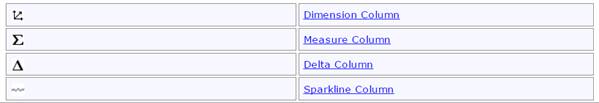
To change the column type, click the column type indicator. In the invoked Column Options window, select the required column type in the Column type section.
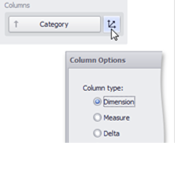
5.4.2.2.2 Dimension Column
The dimension column displays values from the bound data item "as is".
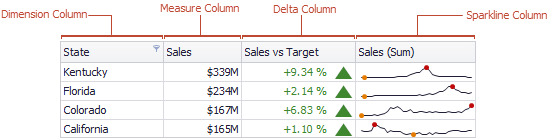
If the dimension column is bound to a data source containing images, it can display images.
5.4.2.2.3 Measure Column
A measure column displays summaries calculated against data in a bound data item.
Values in the measure column can be displayed as text or represented by bars.

To select between these modes, invoke the Column Options window (see Column Type Overview to learn how to do this) and select Value or Bar.
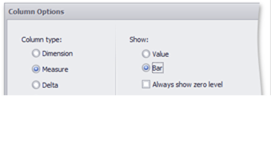
If bars are displayed, use the Always show zero level check box to specify whether the bar's zero level is always visible.
5.4.2.2.4 Delta Column
A delta column calculates summaries against two measures, and displays the difference between these summaries. This difference can be indicated with a numeric value displayed within the delta element and an additional delta indication.

Delta columns are bound to two measures that provide two values: the Actual value and the Target value. The difference between these values is displayed in the column.
When you switch the column type to Delta, the data item container is changed, to accept the Actual and Target measures.
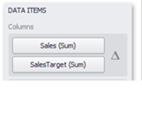
Values in the delta column can be displayed as text, or represented by bars.
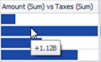
To select between these modes, invoke the Column Options window (see the Column Type Overview topic to learn how to do this) and select Value or Bar.
If bars are displayed, use the Always show zero level check box to specify whether the bar's minimum value is zero (checked) or an automatically selected value that ensures that the difference between bars is clearly displayed (unchecked).
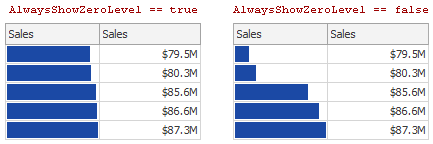
If the display type is set to Value, the Column Options window displays options that allow you to configure delta values and indication.
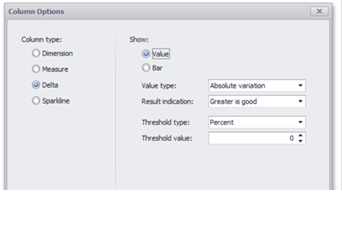
You can specify which values should be displayed in the delta column. To do this, use the Value type combo box in the Column Options window.
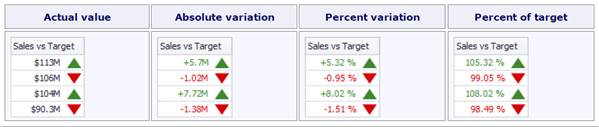
To specify the condition for displaying delta indication, use the Result indication combo box in the Column Options window.
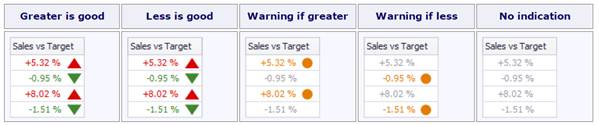
The comparison tolerance allows you to specify more advanced conditions for displaying delta indication. For instance, you can set a specific indication to be displayed when the actual value exceeds the target value by 10% or by $2K.
Use the Threshold type combo box to select whether you wish to specify the comparison tolerance in percentage values or in absolute values. Then use the Threshold value box to specify the comparison tolerance.
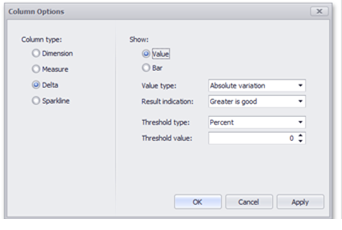
5.4.2.2.5 Sparkline Column
A sparkline column visualizes the variation in summary values over time.
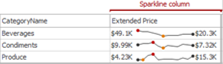
The sparkline column is bound to a measure providing sparkline values and to a dimension providing a date-time interval.
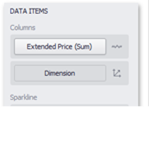
You can control sparkline appearance settings using the Column Options dialog. To invoke this dialog, click the column type indicator ( ).
).
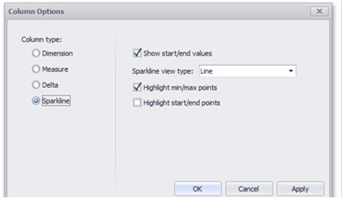
In this dialog, you can control various settings that affect how the sparkline is displayed within a grid cell.
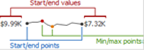
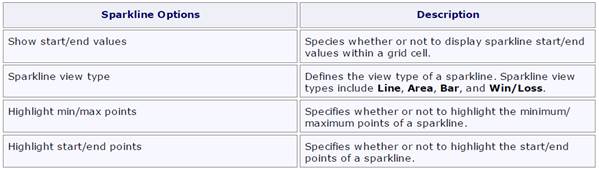
5.4.2.3 Interactivity
This section describes features that enable interaction between the Grid and other dashboard items. These features include Master Filtering and Drill-Down.
5.4.2.3.1 Master Filtering
The Dashboard designer allows you to use any data-aware dashboard item as a filter for the entire dashboard (Master Filter). To learn more, see the Master Filtering topic, which describes filtering concepts common to all dashboard items.
The Grid dashboard item supports filtering by rows.
When Master Filtering is enabled, you can click a grid row (or multiple rows by holding down the CTRL key) to make other dashboard items only display data related to the selected record(s).
To learn how to enable Master Filtering in the Designer, see the Master Filtering topic.
To reset filtering, use the Clear Master Filter button (the  icon) in the grid's caption area, or the Clear Master Filter command in the grid's context menu.
5.4.2.3.2 Drill-Down
The built-in drill-down capability allows you to change the detail level of data displayed in dashboard items on the fly. To learn more about drill-down concepts common to all dashboard items, see the Drill-Down topic.
The Grid dashboard item supports drill-down for rows.
When drill-down is enabled, you can click a grid row to view the details.
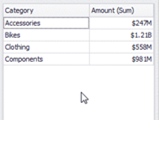
Drill-down requires that the Columns section contains several dimensions at the top, from the least detailed to the most detailed dimension.
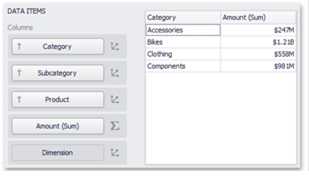
To enable drill-down, click the Drill Down button in the Data Ribbon tab.
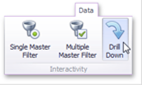
To return to the previous detail level (drill up), use the Drill Up button (the  icon) within the grid's caption area, or the Drill Up command in the grid's context menu.

5.4.2.4 Layout
The Grid dashboard item allows you to customize its layout in various ways. You can manage the width of grid columns, specify the visibility of column headers, enable cell merging, etc.
To do this, use the Layout and Column Width Mode groups in the Design Ribbon tab (or the corresponding buttons in the toolbar menu).
The Grid dashboard item allows you to manage column widths using different modes. Use buttons in the Column Width Mode group to manage the column width modes.
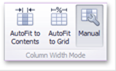
The following modes are available:
- AutoFit to Contents: The grid adjusts columns to the minimum width required to completely display their content automatically. If the entire content cannot be displayed within the dashboard item, horizontal scrolling is enabled.
- AutoFit to Grid: The grid adjusts the width of all columns to fit their content in an optimal way. If you are changing the size of the dashboard item, the width of columns is changed proportionally.
-
Manual: The grid allows you to adjust column widths manually. In this mode, you can adjust the width of individual columns in the following ways:
-
Specify the width of the required column by dragging the right edge of the column header.
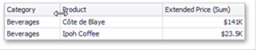
In this case, all columns preserve their relative size when the grid width is changed.
- Specify the column width and fix it by right-clicking the required column header and selecting Fix Width.
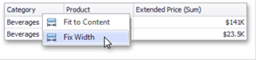
- Fit the column width to its content and fix it by right-clicking the required column header and selecting Fit to Content.
Use the Column Headers button to toggle column header visibility.
The Grid allows you to merge neighboring cells with identical values. To do this, use the Merge Cells button.
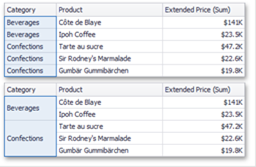
The word wrapping feature enables the capability to display cell content on multiple lines if the size of a dashboard item is insufficient to completely display the cell content on a single line.
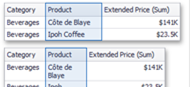
5.4.2.5 Style
The Grid dashboard item allows you to specify various style settings. To do this, use the Style group in the Design Ribbon tab (or the corresponding buttons in the toolbar menu).
5.4.2.5.1 Grid Lines
The Horizontal Lines and Vertical Lines buttons control grid line visibility.
5.4.2.5.2 Banded Rows
To paint the background of odd and even rows differently, use the Banded Rows button.
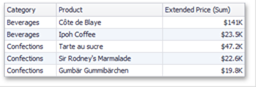
5.4.3 Pies
The Pie dashboard item displays a series of pies or donuts that represent the contribution of each value to a total. The Dashboard Designer allows you to bind various dashboard items to data in a virtually uniform manner.
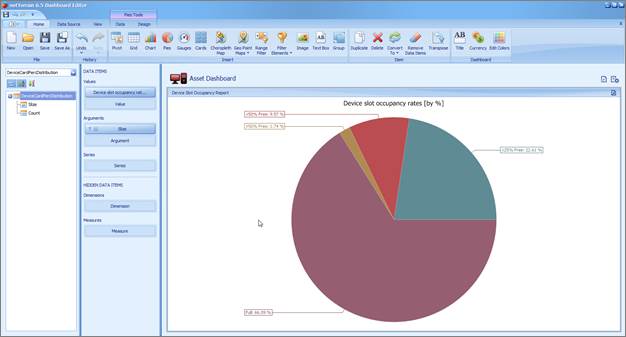
Pie chart example
The Pie dashboard item has the following data sections:
- The Values section contains data items that define the share of pie segments.
- The Arguments section contains data items that provide values used to label pie segments.
- The Series section contains data items whose values are used to label pie charts.
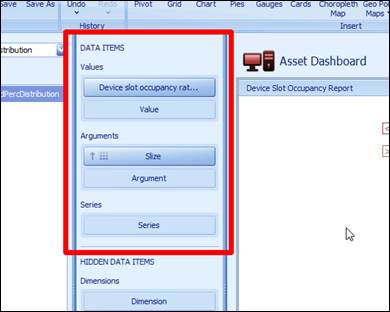
The Pie dashboard item allows you to manage coloring of their measures and dimensions. The Pie dashboard item provides the capability to transpose pie arguments and series. In this case, data items contained in the Arguments section are moved to the Series section, and vice versa.
To transpose the selected Pie dashboard item, use the Transpose button in the Home menu.
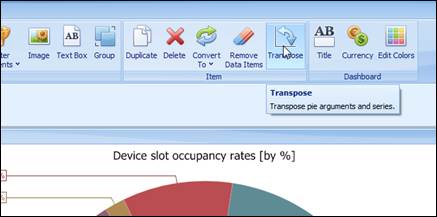
5.4.3.1 Interactivity
Pies enable interaction between the Pie dashboard item and other items. These features include Master Filtering and Drill-Down.
5.4.3.1.1 Master Filtering
The Dashboard allows you to use any data aware dashboard item as a filter for other dashboard items (Master Filter). The Pie dashboard item supports filtering by argument or series values. When filtering by arguments is enabled, an end-user can click a pie segment to make other dashboard items only display data related to the selected argument value.
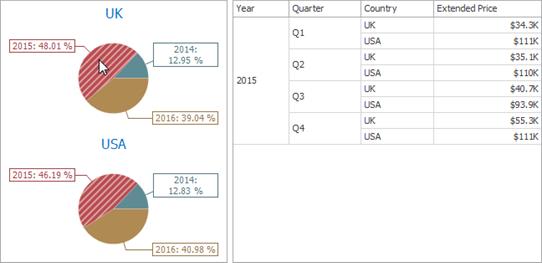
To enable filtering by arguments in the Designer, set the required Master Filter mode and click the Arguments button in the Data Ribbon tab (or the  button if you are using the toolbar menu).
When filtering by series is enabled, an end-user can click a pie to make other dashboard items display only data related to the selected pie.
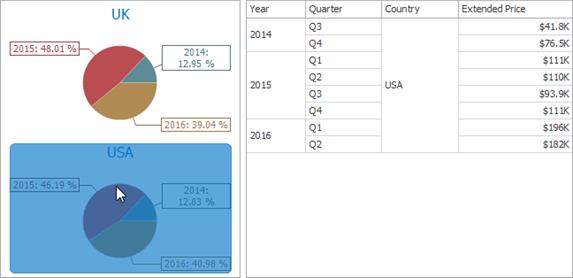
To enable filtering by series in the Designer, set the required Master Filter mode and click the Series button in the Data Ribbon tab (or the  button if you are using the toolbar menu).
When filtering by points is enabled, an end-user can click a single pie segment to make other dashboard items display only data related to the selected segment.
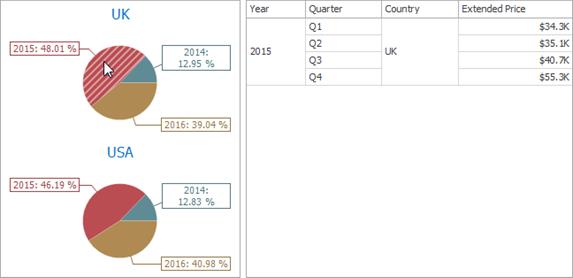
To enable filtering by points in the Designer, set the required Master Filter mode and click the Points button in the Data Ribbon tab.
5.4.3.1.2 Drill – Down
The built-in drill-down capability allows end-users to change the detail level of data displayed in dashboard items on the fly. To learn more about drill-down concepts common to all dashboard items, see the Drill-Down topic.
The Pie dashboard item supports drill-down on argument or series values.
When drill-down on arguments is enabled, an end-user can click a pie segment to view a detail diagram for the corresponding argument value. When Filtering by Arguments is enabled, an end-user can view the details by double-clicking a pie segment.
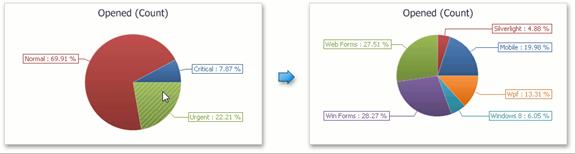
Drill-down on arguments requires that the Arguments section contains several data items, from the least detailed to the most detailed item.
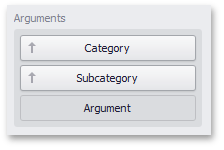
To enable drill-down on arguments, click the Drill Down button in the Data Ribbon tab (or the  button if you are using the toolbar menu)
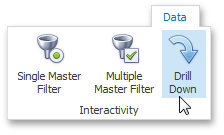
and the Arguments button (or the button if you are using the toolbar menu).
When drill-down on series is enabled, an end-user can click a pie chart to view a detail diagram for the corresponding series value. When Filtering by Series is enabled, an end-user can view the details by double-clicking a pie chart.
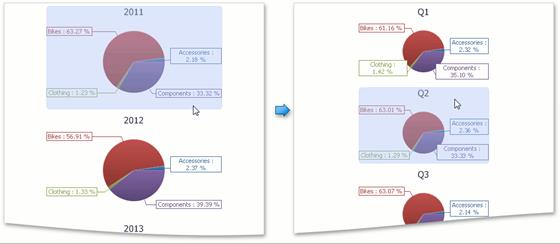
Drill-down on series requires that the Series section contains several data items, from the least detailed to the most detailed item.
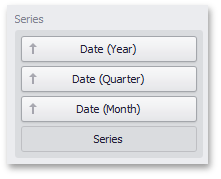
To enable drill-down on series, click the Drill Down button in the Data Ribbon tab (or the button if you are using the toolbar menu)
and the Series button (or the button if you are using the toolbar menu).
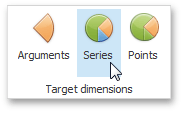
To return to the previous detail level (drill-up), use the Drill Up ( ) button in the caption of the Pie dashboard item, or the Drill Up command in the context menu.
5.4.3.2 Pie Layouts
The Pie dashboard item allows you to specify the number of columns or rows in which individual diagrams are arranged.
To control how pies are arranged, use the Content Arrangement group in the Design Ribbon tab.
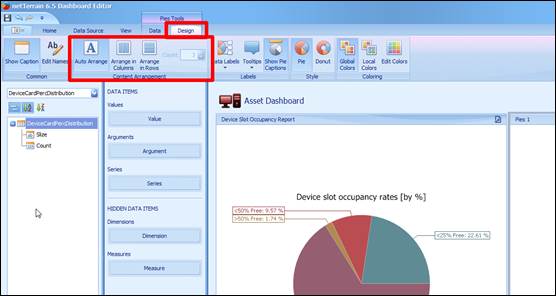
By default, the Auto Arrange option is enabled, which automatically resizes pies to fit within the dashboard item.
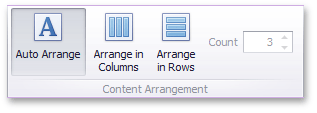
If you are using the toolbar menu, use the  button to enable this mode.
You can also specify the number of columns in which pies are arranged. Click the Arrange in Columns button (or the  button if you are using the toolbar menu) and specify the appropriate number in the Count field.
Similarly, you can arrange pies in a specific number of rows (use the  button if you are using the toolbar menu).
5.4.3.3 Pie Labels
Pies display data labels that contain descriptions for pie segments and provide tooltips with additional information.
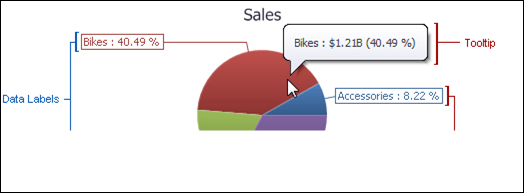
You can specify which information should be displayed within data labels and tooltips. To do this, use the Data Labels and Tooltips buttons in the Design Ribbon tab (or the  and
and  buttons if you are using the toolbar menu).
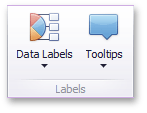
These buttons invoke the drop-down menu, which is similar for both buttons. This menu allows you to specify which values are displayed within data labels or tooltips.
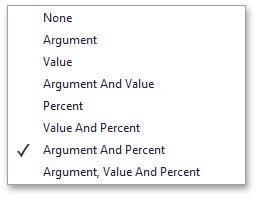
5.4.3.4 Pie Style
The Pie dashboard item allows you to select whether diagrams should be painted as pies or donuts.
To select the diagram style, use the Pie and Donut buttons in the Style section of the Design Ribbon tab (or the  and
and  buttons if you are using the toolbar menu).
5.4.4 Cards
The Card dashboard item displays a series of cards. Each card illustrates the difference between two values. This difference can be expressed as an absolute value, an absolute variation or a percentage variation.
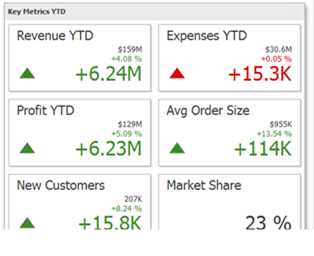
Card example
This section consists of the following subsections:
- Providing Data: Provides information about how to supply the Card dashboard item with data.
- Delta: Provides an overview of the Card dashboard item's capability to display the difference between two parameters.
- Sparkline: Provides an overview of the Card dashboard item's capability to visualize data using sparklines.
- Interactivity: Describes features that enable interaction between the Card dashboard item and other items.
- Layout: Describes layout options of the Card dashboard item.
5.4.4.1 Providing Data
This topic describes how to bind a Card dashboard item to data in the Dashboard Designer.
The Dashboard Designer allows you to bind various dashboard items to data in a virtually uniform manner (see the Binding Dashboard Items to Data topic for details).
The only difference is in the data sections that these dashboard items have.
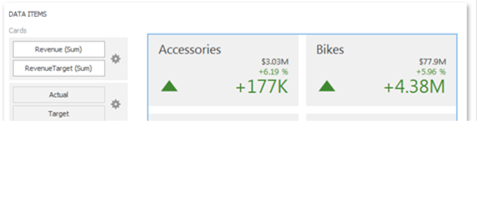
5.4.4.1.1 Data Sections
The Cards section contains data items used to calculate values displayed within cards.
Data items are arranged in containers. Each data item container can hold two data items. The first item contains actual data and the second item (optional) contains target data. If both items are provided, cards show the difference between actual and target values.
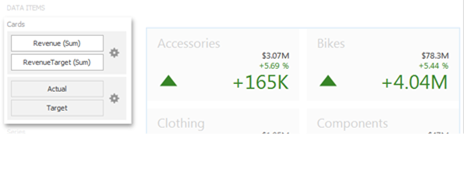
If only one item is provided, cards display values from this item.
You can fill several data item containers in the Cards section and use the Values drop-down menu to switch between the provided values. To invoke the Values menu, click the icon in the dashboard item caption.
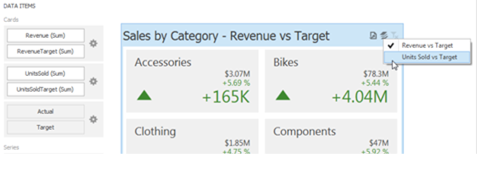
The Series section contains data items whose values are used to label cards.
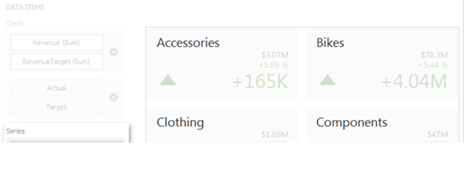
The Sparkline section is used to provide a date-time dimension whose data will be used to visualize values using sparklines.
5.4.4.2 Delta
Cards allow you to display the difference between the actual and target values of a particular parameter. This difference is called delta.
Delta is shown with a delta indicator (indicating whether the actual value is less than or greater than the target value) and delta values (representing this difference as an absolute value or a variation).
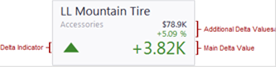
To customize settings that relate to the calculation and display of deltas, use the options buttons (the  icon) displayed next to the data item container in the Cards section of the DATA ITEMS pane.
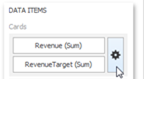
These buttons invoke the Card Settings dialog.
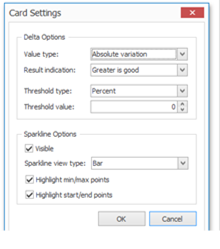
Use it to define the conditions for displaying delta indication, specify which delta values should be displayed, and introduce the comparison tolerance. This dialog also allows you to control various sparkline options.
5.4.4.2.1 Delta Values
You can specify which values should be displayed within cards. Use the Value type combo box in the Card Settings window to select the value that will be displayed as the main delta value. Additional delta values are selected automatically.
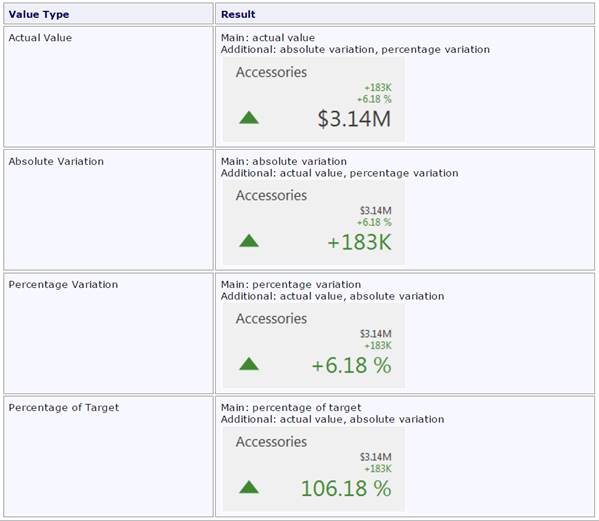
5.4.4.2.2 Delta Indication
You can specify the condition for displaying delta indication. To do this, use the Result indication combo box in the Card Settings window.
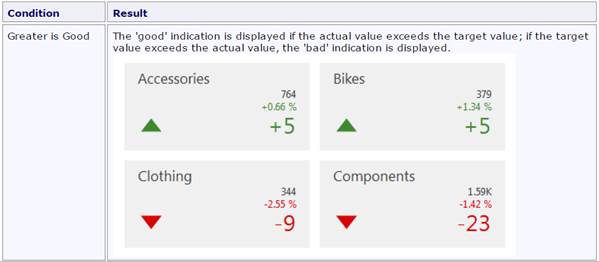
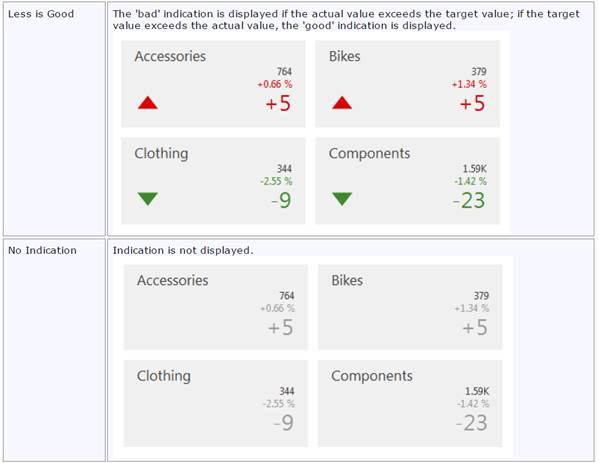

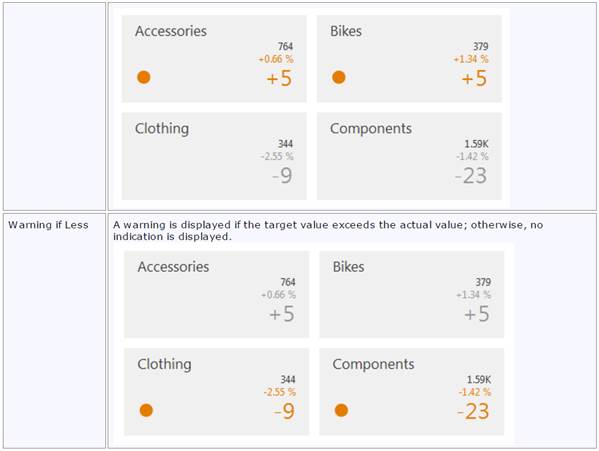
5.4.4.2.3 Comparison Tolerance
The comparison tolerance allows you to create more advanced conditions for displaying delta indication. For instance, you can specify that a specific indication should be displayed when the actual value exceeds the target value by 10% or by $2K.
Use the Threshold type combo box to select whether you wish to specify the comparison tolerance in percentage values or in absolute values. Then use the Threshold value box to specify the comparison tolerance.
5.4.4.3 Sparkline
Sparklines can be used in cards to visualize the variation of actual (or target) values over time.
5.4.4.3.1 Data Binding Specifics
To display a sparkline within a card, provide a date-time dimension whose data will be used to visualize values over time.
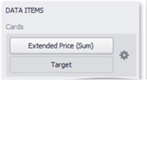
Note that if you have provided both actual and target values, a sparkline visualizes the actual value's variation over time.
5.4.4.3.2 Sparkline Options
You can control sparkline appearance settings using the Card Settings dialog. To invoke this dialog, click the options button (the  icon) displayed next to the data item container.
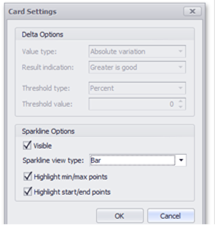
In this dialog, you can control various settings that affect how the sparkline is displayed within a card.
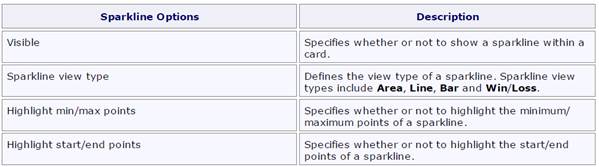
5.4.4.4 Interactivity
This section describes features that enable interaction between the Card dashboard item and other items. These features include Master Filtering and Drill-Down.
5.4.4.4.1 Master Filtering
The Dashboard designer allows you to use any data-aware dashboard item as a filter for the entire dashboard (Master Filter). To learn more about filtering concepts common to all dashboard items, see the Master Filtering topic.
When Master Filtering is enabled, you can click a card (or multiple cards by holding down the CTRL key) to make other dashboard items only display data related to the selected card(s).
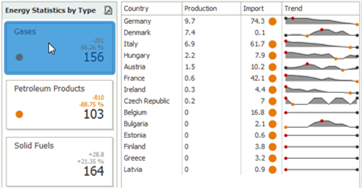
To reset filtering, use the Clear Master Filter button (the  icon) in the caption of the Card dashboard item, or the Clear Master Filter command in the Card's context menu.
5.4.4.4.2 Drill-Down
The built-in drill-down capability allows you to change the detail level of data displayed in dashboard items on the fly. To learn more about drill-down concepts common to all dashboard items, see the Drill-Down topic.
When drill-down is enabled, you can click a card to view the details.
Drill-down requires that the Series section contains several dimensions, from the least to the most detailed dimension.
To enable drill-down, click the Drill Down button in the Data Ribbon tab (or the  button if you are using the toolbar menu).
To return to the previous detail level (drill up), use the Drill Up button (the  icon) in the caption of the Card dashboard item, or the Drill Up command in the Card's context menu.
5.4.4.5 Layout
The Card dashboard item allows you to specify the number of columns or rows in which individual cards are arranged.
To control how cards are arranged, use the buttons in the Content Arrangement group of the Design Ribbon tab. The Auto Arrange option is enabled by default, which automatically resizes cards to fit within the dashboard item.
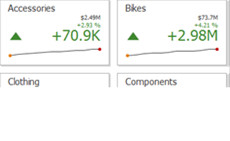
If you are using the toolbar menu, use the  button to enable this mode.
You can also specify the number of columns in which cards are arranged. Click the Arrange in Columns button (or the  button if you are using the toolbar menu) and specify the appropriate number in the Count field.
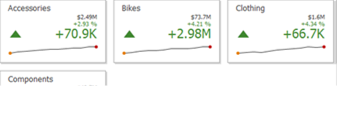
Similarly, you can arrange cards in a specific number of rows (use the  button if you are using the toolbar menu).
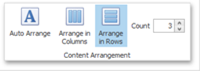
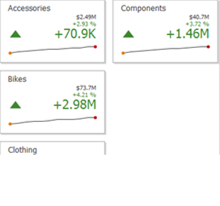
5.4.5 Gauges
The Gauge dashboard item displays a series of gauges. Each gauge can communicate two values - one with a needle and the other with a marker on the scale.
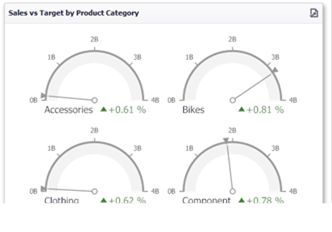
This section consists of the following subsections:
- Providing Data: Provides information about how to supply the Gauge dashboard item with data.
- Delta: Provides an overview of the Gauge dashboard item's capability to display the difference between two parameters.
- Gauge Scale: Describes options that relate to the gauge scales.
- Interactivity: Describes features that enable interaction between the Gauge dashboard item and other items.
- Layout: Describes layout options of the Gauge dashboard item.
- Style: Provides information about how to specify the gauge style.
5.4.5.1 Providing Data
This topic describes how to bind a Gauge dashboard item to data in the Dashboard Designer.
The Dashboard Designer allows you to bind various dashboard items to data in a virtually uniform manner (see Binding Dashboard Items to Data for details). The only difference is in the data sections that these dashboard items have.
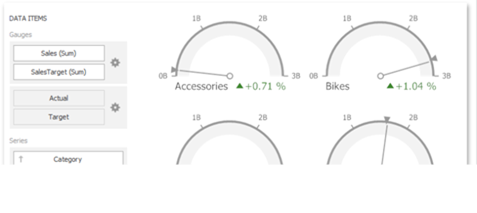
5.4.5.1.1 Data Sections
The Gauges section contains data items used to calculate the values displayed by gauges.
Data items are arranged in containers. Each data item container can hold two data items. The first item contains actual data and the second item (optional) contains target data. If both items are provided, gauges show the difference between actual and target values.
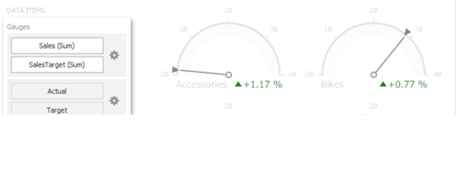
If only one item is provided, gauges display values from this item.
You can fill several data item containers in the Gauges section and use the Values drop-down menu to switch between the provided values. To invoke the Values menu, click the  icon in the dashboard item caption.
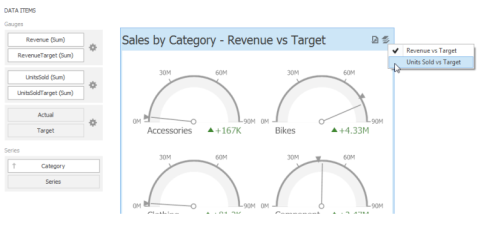
The Series section contains data items whose values are used to label gauges.
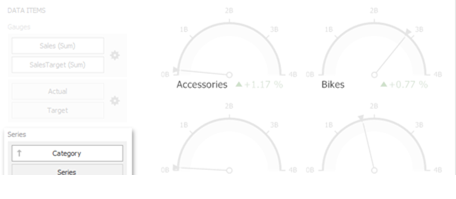
5.4.5.2 Delta
Gauges allow you to display the difference between the actual and target values of a particular parameter. This difference is called delta.
Delta is shown with a delta indicator (indicating whether the actual value is less than or greater than the target value) and delta values (representing this difference as an absolute value or a variation).
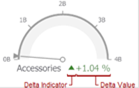
To customize settings that relate to the calculation and display of deltas, use the options buttons (the  icon) displayed next to the data item container in the Gauges section of the DATA ITEMS pane.
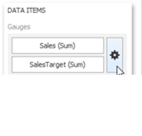
These buttons invoke the Gauge Options dialog.
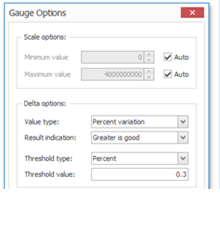
Use it to define the condition for displaying delta indication, specify which delta values should be displayed, and introduce the comparison tolerance.
5.4.5.2.1 Delta Values
You can specify which values should be displayed within gauges. Use the Value type combo box in the Gauge Options window to select the value that will be displayed as the delta value.
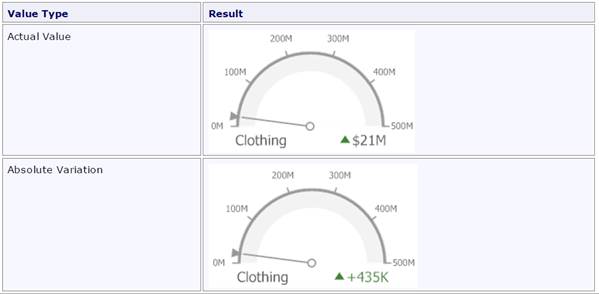
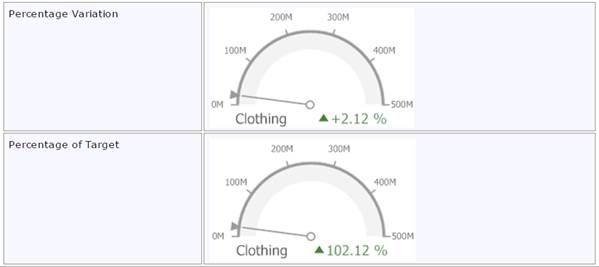
5.4.5.2.2 Delta Indication
You can specify the condition for displaying delta indication. To do this, use the Result indication combo box in the Gauge Options window.
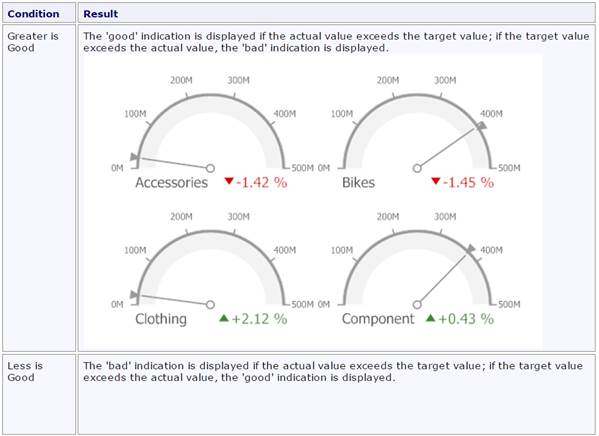
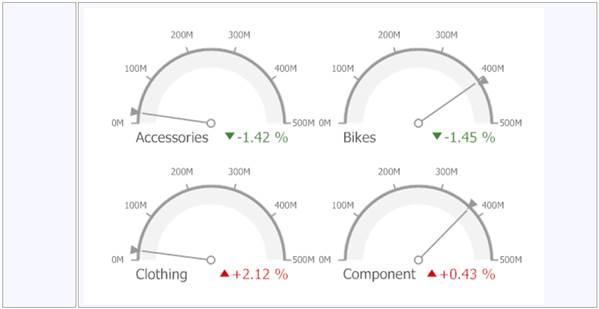
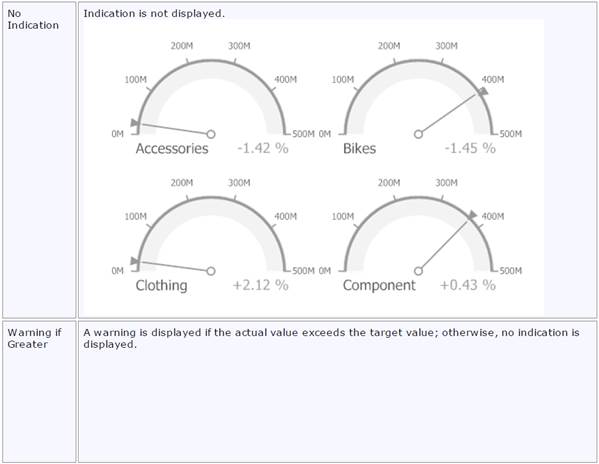
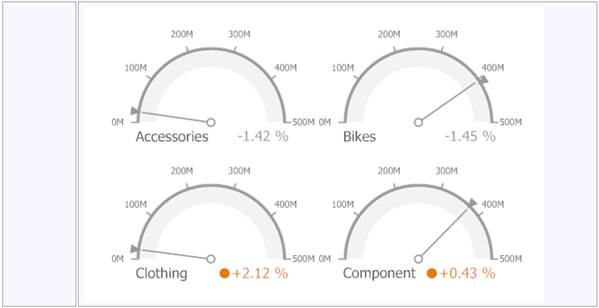
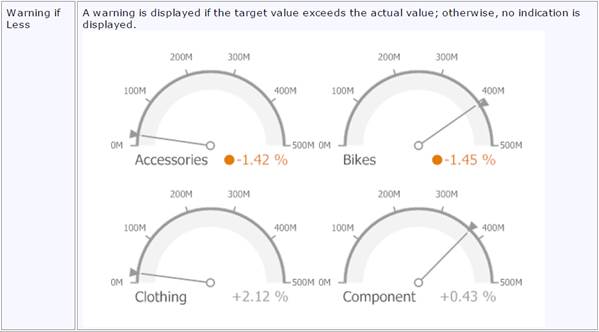
5.4.5.2.3 Comparison Tolerance
The comparison tolerance allows you to create more advanced conditions for displaying delta indication. For instance, you can specify that a specific indication should be displayed when the actual value exceeds the target value by 10% or by $2K.
Use the Threshold type combo box to select whether you wish to specify the comparison tolerance in percentage values or in absolute values. Then use the Threshold value box to specify the comparison tolerance.
5.4.5.3 Gauge Scale
By default, the Gauge dashboard item automatically determines the range of the gauge scales based on the values they display.
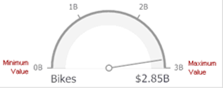
You can override this behavior and specify the maximum and minimum values on the scale.
To do this, invoke the Gauge Options window using the Options button displayed in the data item container in the Gauges section of the DATA ITEMS pane.

In the Gauge Options window, uncheck the Auto check box for the maximum or minimum value, and specify this value in the corresponding field.
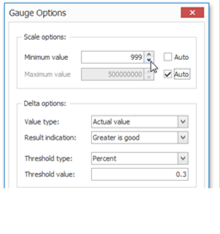
5.4.5.4 Interactivity
This section describes features that enable interaction between the Gauge dashboard item and other items. These features include Master Filtering and Drill-Down.
5.4.5.4.1 Master Filtering
The Dashboard designer allows you to use any data-aware dashboard item as a filter for the entire dashboard (Master Filter). To learn more about filtering concepts common to all dashboard items, see the Master Filtering topic.
When Master Filtering is enabled, you can click a gauge (or multiple gauges by holding down the CTRL key) to make other dashboard items only display data related to the selected gauge(s).
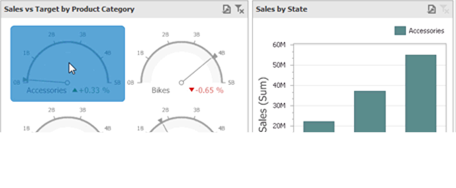
To reset filtering, use the Clear Master Filter button (the  icon) in the caption of the Gauge dashboard item, or the Clear Master Filter command in the Gauge’s context menu.
5.4.5.4.2 Drill-Down
The built-in drill-down capability allows you to change the detail level of data displayed in dashboard items on the fly. To learn more about drill-down concepts common to all dashboard items, see the Drill-Down topic.
When drill-down is enabled, you can click a gauge to view the details.
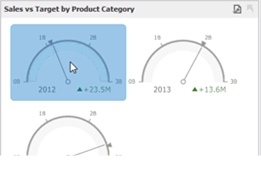
Drill-down requires that the Series section contains several dimensions, from the least to the most detailed dimension.
To enable drill-down, click the Drill Down button in the Data Ribbon tab (or the  button if you are using the toolbar menu).
To return to the previous detail level (drill up), use the Drill Up button (the  icon) in the caption of the Gauge dashboard item, or the Drill Up command in the Gauge’s context menu.

5.4.5.5 Layout
The Gauge dashboard item allows you to specify the number of columns or rows in which individual Gauges are arranged.
To control how Gauges are arranged, use the buttons in the Content Arrangement group of the Design Ribbon tab.
The Auto Arrange option is enabled by default, which automatically resizes Gauges to fit within the dashboard item.
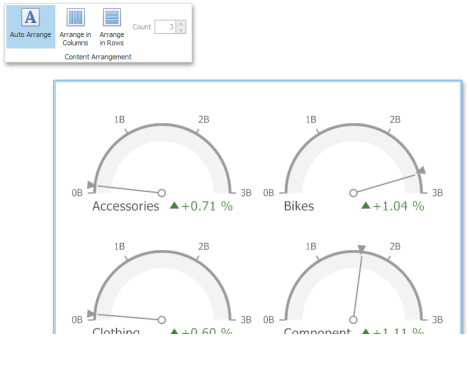
If you are using the toolbar menu, use the  button to enable this mode.
You can also specify the number of columns in which Gauges are arranged. Click the Arrange in Columns button (or the button if you are using the toolbar menu) and specify the appropriate number in the Count field.
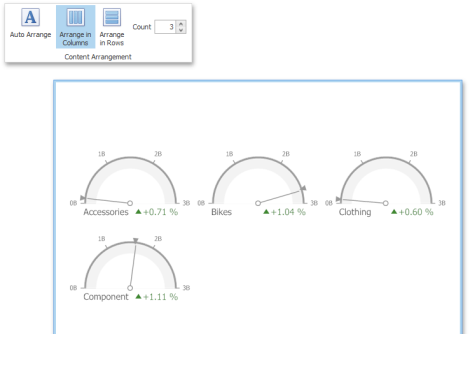
Similarly, you can arrange Gauges in a specific number of rows (use the  button if you are using the toolbar menu).
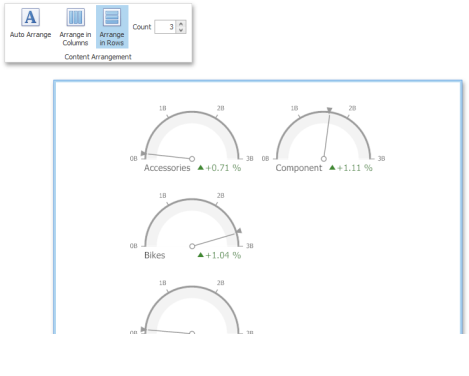
5.4.5.6 Style
The Gauge dashboard item allows you to select the gauge type.
The following types are supported:
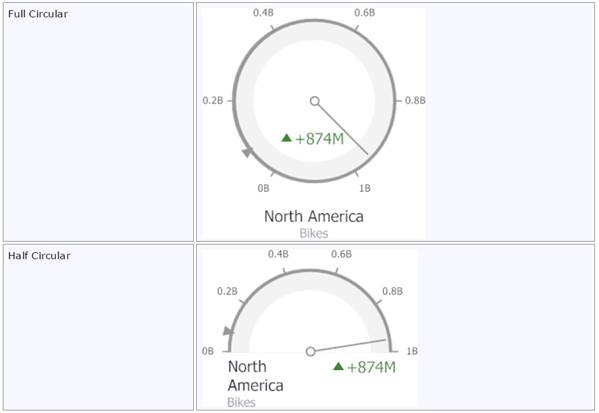
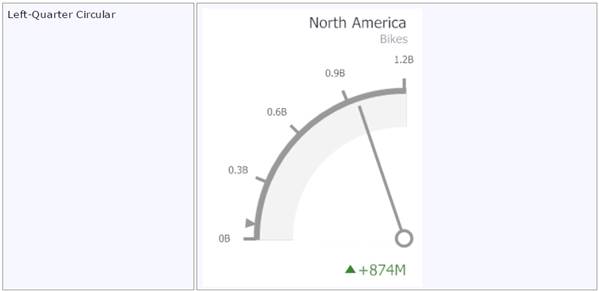
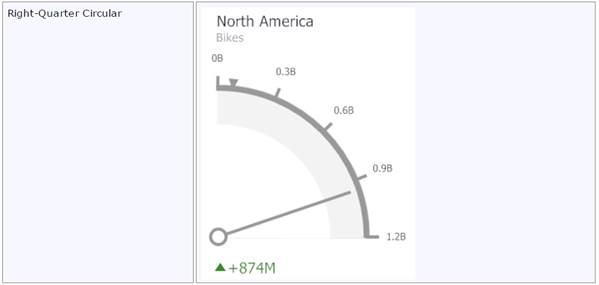
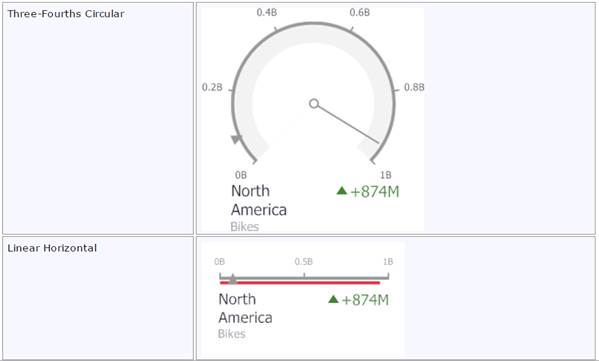
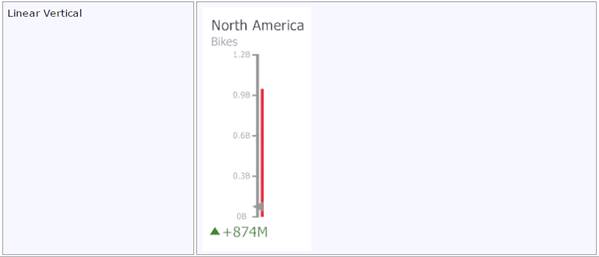
To select the gauge type, use the buttons in the Style group of the Design Ribbon tab.
5.4.6 Pivot
The Pivot dashboard item displays a cross-tabular report that presents multi-dimensional data in an easy-to-read format.
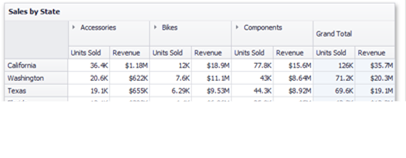
5.4.6.1 Providing Data
This topic describes how to bind a Pivot dashboard item to data in the Dashboard Designer.
The Dashboard Designer allows you to bind various dashboard items to data in a virtually uniform manner (see Binding Dashboard Items to Data for details). The only difference is in the data sections that these dashboard items have.
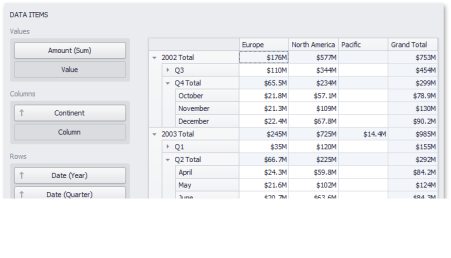
5.4.6.1.1 Data Sections
The Values section contains data items used to calculate values displayed in the pivot table.
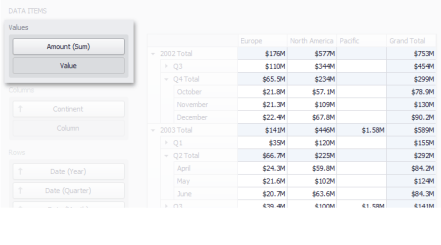
The Columns section contains data items whose values are used to label columns.
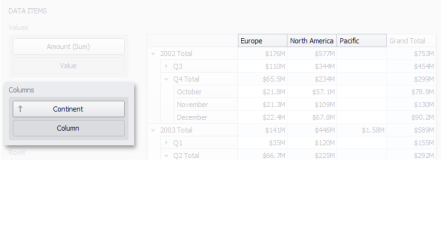
The Rows section contains data items whose values are used to label rows.
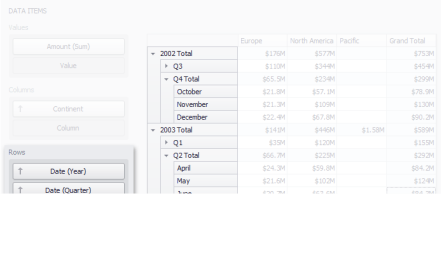
5.4.6.1.2 Transposition
The Pivot dashboard item provides the capability to transpose pivot columns and rows. In this case, data items contained in the Columns section is moved to the Rows section, and vice versa.
To transpose the selected Pivot dashboard item, use the Transpose button in the Home ribbon tab.
5.4.6.2 Layout
This topic describes how to control the pivot table layout.
5.4.6.2.1 Expanding and Collapsing Groups
If the Columns section or Rows section contains several data items, the pivot table column and row headers are arranged in a hierarchy and make up column and row groups.
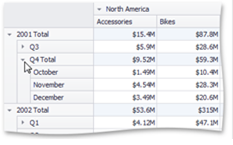
You can collapse and expand row and column groups using the  and
and  buttons.
5.4.6.2.2 Initial Collapsed State
The actual collapsed state of column and row groups in the Designer is not saved in the Dashboard. However, the Dashboard allows you to specify the collapsed state to be applied in the Viewer by default.
To do this, use the Initial State button in the Data Ribbon group (or the  button if you are using the toolbar menu).
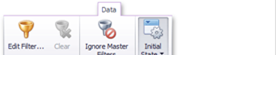
This button invokes a popup menu that allows you to select whether column and row groups should be collapsed or expanded by default in the Dashboard Viewer.
5.4.7 Choropleth Map
The topics in this section describe the features available in the Choropleth Map dashboard item.
The Choropleth Map dashboard item allows you to colorize the required areas in proportion to the provided values.
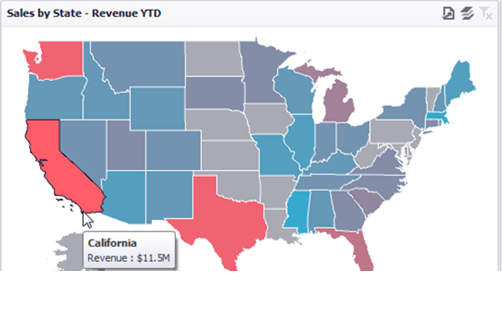
This section consists of the following subsections:
- Providing Maps: Describes how to use default dashboard maps or provide custom maps.
- Providing Data: Explains how to supply the Choropleth Map dashboard item with data.
- Map Coloring: Details how to color map shapes based on the values provided.
- Map Navigation: Explains how to manage map zooming and scrolling.
- Interactivity: Describes features that enable interaction between the Choropleth Map and other dashboard items.
- Labels: Describes how to display additional information related to map shapes.
- Legend: Explains the map legend and its options.
5.4.7.1 Providing Maps
This document explains how to use the default netTerrain Dashboard maps or provide custom maps.
5.4.7.1.1 Default Maps
The netTerrain Dashboard Designer ships with a set of default maps showing various parts of the world. The following maps are included:
- World
- Europe
- Asia
- North America
- South America
- Africa
- USA
- Canada
To select the required default map, use the Default Map button in the Open group of the Design ribbon tab (or click the  button if you are using the toolbar menu).
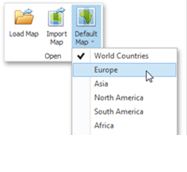
5.4.7.1.2 Map Attributes
After you select the default map or a custom map, you can view supplemental information (such as the name of the country, state, etc.). To do this, click the Options button next to the Attribute placeholder.
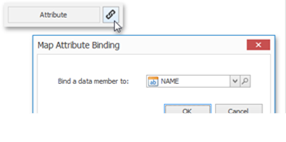
In the invoked Map Attribute Binding dialog, click Preview.
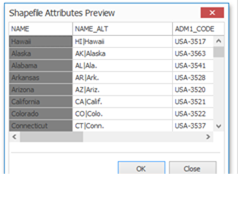
This table displays the available attributes for the current map. Each set of attribute values is related to a specific map shape.
5.4.7.2 Providing Data
This topic describes how to bind a Choropleth Map dashboard item to data using the Dashboard Designer. The Dashboard Designer allows you to bind various dashboard items to data in a virtually uniform manner (see Binding Dashboard Items to Data for details). The only difference is in the data sections that these dashboard items have.
5.4.7.2.1 Data Sections
The Choropleth Map has the Attribute and Maps data sections.
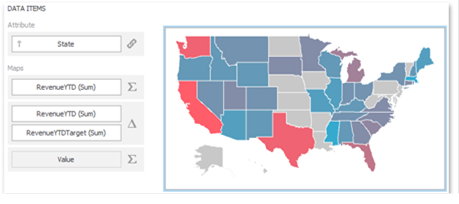
The Attribute data section contains the Attribute data item, which allows you to associate map shapes with data source field values.
To associate map shapes with data source field values, drag-and-drop the required dimension to the data item's placeholder and select the required attribute in the Map Attribute Binding dialog. To invoke this dialog, click the Options button (the  icon) next to the Attribute placeholder.
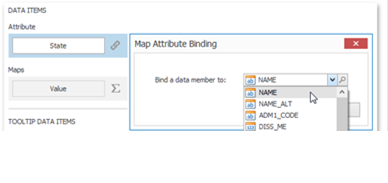
The Maps data section contains data items whose values are used to color map shapes. Map shape colors vary depending on the map type.
Click the Options button (the  icon) next to the Value placeholder and select the required map type in the invoked Choropleth Map Options dialog.
If you select Value, the Choropleth map colors map shapes based on the values provided. To learn more, see Map Coloring.
If you select Delta, the Choropleth map colors map shapes based on the difference between two values. To learn how to specify delta indication settings, see Delta.
5.4.7.2.2 Tooltip Data Items
The Choropleth Map allows you to add supplementary content to the tooltips using the TOOLTIP DATA ITEMS area. Drag and drop the required measures to provide additional data.
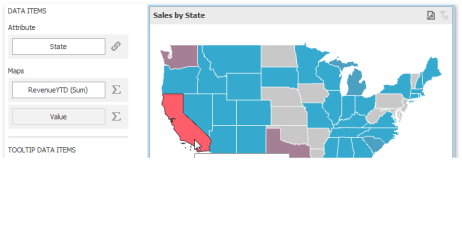
5.4.7.3 Map Coloring
The Choropleth Map dashboard item colors map shapes depending on the data provided.
For instance, you can visualize a sales amount or population density.
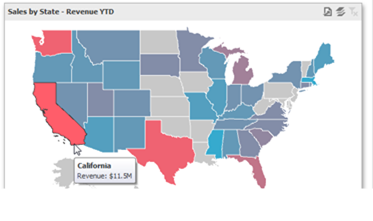
5.4.7.3.1 Palette and Scale Settings
The Choropleth Map automatically selects palette and scale settings to color map shapes.
If you need to customize these settings, click the Options button next to the data item that contains these values.
This invokes the Choropleth Map Options dialog.
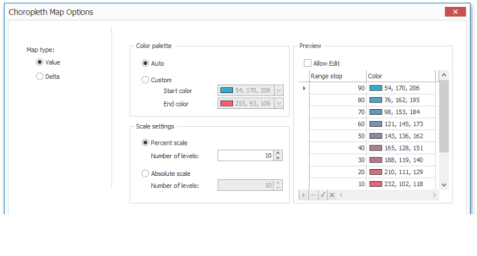
You can specify the following settings in this window:
- Color palette - allows you to specify the start and end color of the palette.
- Scale settings - specifies whether a percent scale or an abs olute scale is used to define a set of colors. You can specify the number of levels that represent the number of colors used to color the map.
- Preview is used to display a full set of palette colors generated based on the start/end colors and the number of levels. Use the Allow Edit check box to automatically change the generated colors or specify value ranges for each color.
To learn how to display a map legend, see Legend.
Also, the Choropleth Map allows you to visualize the difference between the actual and target values of a particular parameter. To learn more, see the Delta topic.
5.4.7.3.2 Delta
The Choropleth Map allows you to indicate the difference between the actual and target values of a particular parameter. This difference is called delta.
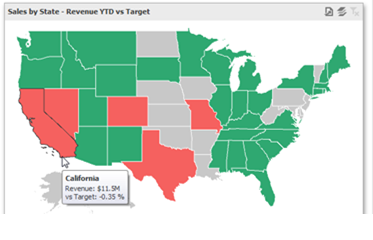
To specify delta indication settings, click the Options button next to the data item container.
This invokes the Choropleth Map Options dialog. When the map type is set to Delta, this dialog contains the following settings:
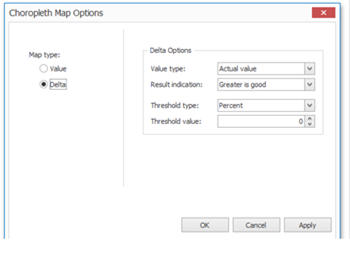
- Value type: You can specify which values to display within map tooltips. Use the Value type combo box to select the value that will be displayed as the delta value.
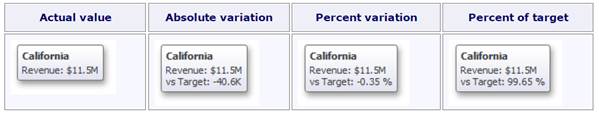
- Result Indication: You can specify the condition that will be used to select the indicator color. To do this, use the Result indication combo box.
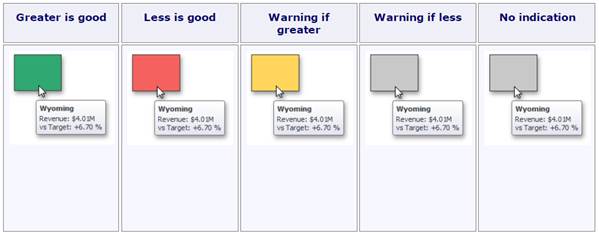
- Threshold type and Threshold value: You can specify that a required indicator should only be displayed when the difference between the actual and target values exceeds a specified value. For instance, the actual value exceeds the target value by 10%, or by $2K. Use the Threshold type combo box to select whether you wish to specify the threshold in percentage values or in absolute values. Then use the Threshold value box to specify the threshold value.
5.4.7.4 Map Navigation
The Choropleth Map dashboard item allows end-users to perform navigation actions such as zooming and scrolling.
The Dashboard Designer allows you to specify the initial zooming/scrolling state for the Choropleth map using the mouse.
You can disable the capability to scroll/zoom the map using the Lock Navigation button in the Design ribbon tab.
Use the Full Extent button to display the entire map within the dashboard item.
5.4.7.5 Interactivity
This section describes features that enable interaction between the Choropleth Map dashboard item and other items.
5.4.7.5.1 Master Filtering
The Dashboard designer allows you to use any data-aware dashboard item as a filter for the entire dashboard (Master Filter). To learn more about filtering concepts common to all dashboard items, see the Master Filtering topic.
When Master Filtering is enabled, you can click a shape (or multiple shapes by holding down the CTRL key) to make other dashboard items only display data related to the selected shape(s).
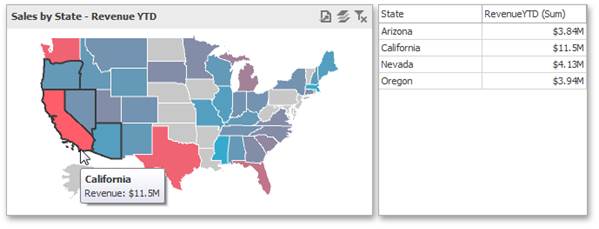
To reset filtering, use the Clear Master Filter button (the  icon) in the caption of the Choropleth Map dashboard item, or the Clear Master Filter command in the map’s context menu.
5.4.7.6 Labels
A Choropleth map provides the capability to display titles within map shapes and allows you to manage which data to show in the shape tooltips.
To manage map titles and tooltips, click the Shape Labels button in the Design ribbon tab.

This invokes the Shape Label Settings dialog.
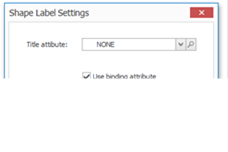
In this dialog, you can specify attributes whose values will be displayed within shapes and tooltips. Use the button to preview the available attributes and their values for the current map.
5.4.7.6.1 Shape Titles
The Title attribute option allows you to select the attribute whose values are displayed within corresponding map shapes.
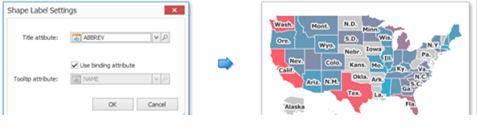
5.4.7.6.2 Tooltips
The Choropleth Map dashboard item displays a tooltip that shows information related to a hovered shape.
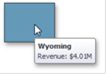
You can choose whether to use a binding attribute to display as the title of shape tooltips (the Use binding attribute checkbox) or specify a custom attribute using the Tooltip attribute option.
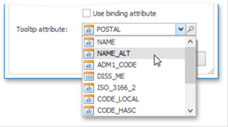
The Choropleth Map also allows you to add supplementary content to the tooltips using the TOOLTIP DATA ITEMS area. To learn more, see the Tooltip Data Items paragraph in the Providing Data topic.
5.4.7.7 Legend
A legend is an element of a map that shows values corresponding to each color.

5.4.7.7.1 Visibility
To display a legend within a map, use the Show Legend button in the Legend group of the Design Ribbon tab.
5.4.7.7.2 Position and Orientation
To specify the legend's position and orientation, select one of the predefined options from the gallery in the Design Ribbon tab.
5.4.8 Range Filter
The Range Filter dashboard item allows you to apply filtering to other dashboard items. This item displays a chart with selection thumbs that allow you to filter out values displayed along the argument axis.
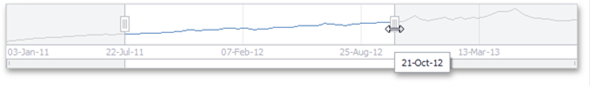
5.4.8.1 Providing Data
This topic describes how to bind a Range Filter dashboard item to data in the Dashboard Designer. The Dashboard Designer allows you to bind various dashboard items to data in a virtually uniform manner (see Binding Dashboard Items to Data for details). The only difference is in the data sections that these dashboard items have.
5.4.8.1.1 Data Sections
The Values section contains data items for calculating the Y-coordinates of data points.
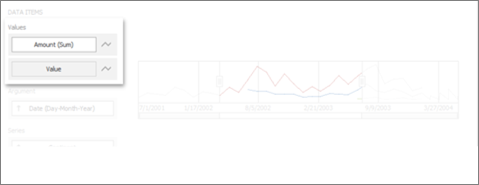
The Arguments section contains data items that provide values displayed along the horizontal axis of the Range Filter. Filtering is performed based on these values.
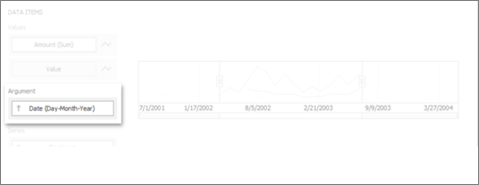
The Series section contains data items whose values are used to create chart series.
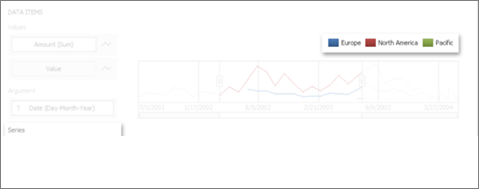
5.4.8.2 Series
The Range Filter dashboard item supports various Line and Area series types.
To switch between series types in the Designer, click the options button next to the required data item in the Values section. In the invoked Series Type dialog, select the required series type and click OK.
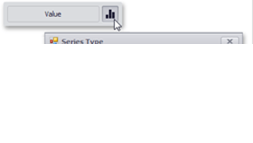
You can also do this using the buttons in the Series Type group of the Design Ribbon tab.
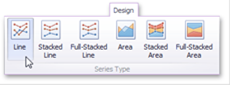
The Range Filter supports the following series types:
5.4.9 Image
Use the Image dashboard item to add static images to a dashboard.
5.4.9.1 Loading an Image
To load an image to a dashboard item, use the Load Image and Import Image buttons in the Ribbon, the corresponding menu buttons in the toolbar (the  or
or  buttons, respectively), or commands in the context menu (Load Image and Import Image, respectively).

These commands invoke the Open dialog, which allows you to locate the desired image.
The Load Image command saves the path to the image in the dashboard definition, while the Import Image command saves the image itself.
5.4.9.1.1 Image Alignment
To specify how the image is aligned within the dashboard item, use the Alignment group in the Design ribbon tab.

5.4.9.1.2 Image Size Mode
You can specify the image size mode that defines how the image fits within the dashboard item.
To do this, use the Size Mode group in the Ribbon's Design tab.
5.4.10 Text Box
Use the Text Box dashboard item to display rich text within a dashboard.
5.4.10.1 Editing Text
To edit text within the text box, click the Edit button in the Design ribbon tab, the corresponding item in the context menu, or double-click the Text Box dashboard item.
This invokes the Edit Text window in which you can edit the text content and customize its formatting.
5.4.11 Dashboard Item Group
The Dashboard designer provides the capability to combine dashboard items into a group. The dashboard item group serves two main purposes:
- Combine dashboard items within the dashboard into a separate layout group.
- Manage interaction between dashboard items within and outside the group.
For instance, you can combine related filter elements and data visualization dashboard items into a group.
5.4.11.1 Create a Group
To create a new group, use the Group button in the Home ribbon tab.

You can add dashboard items to a group and manage item layout using drag-and-drop. To learn how to manage a group's caption, see the Dashboard Item Caption topic.
5.4.11.2 Interactivity
The dashboard item group provides the capability to manage interaction between dashboard items within and outside the group.
The Master Filter button allows you to specify whether the current group allows you to filter external dashboard items using master filter items contained within the group. If this option is disabled, master filter items contained within the group can filter only dashboard items from this group.

The Ignore Master Filters button allows you to isolate dashboard items contained within the group from being filtered using external master filter items.